Saturday, June 28, 2008

The polar bear disaster

A sidelight on the strange world of climate hysteria and what Official Science has done to us ....

The "endangered polar bear" fiasco is an example of the madness of manufactured ignorance. The new Bush administration position, putting forth polar bears as endangered but attempting to not invoke the full regulatory apparatus of the Endangered Species Act, is an incoherent piece of cynical political maneuvering. The decision should be rescinded immediately.

For one thing, the decision puts us in immediate conflict with Canada and other Arctic-bordering countries. Polar bear numbers are healthy, and there are more than a few decades ago. ("Endangered" means populations so small they risk not being able to reproduce themselves.) Instead, the new policy is based on speculative judgments about the Arctic ice shrinking, in spite of the facts: the polar bear population is growing, most of the Arctic ice is not shrinking, the Antarctic is cooling and icing up, and polar bears range mainly along shorelines. There's no scientific basis for considering them endangered.

Here's another case of the authoritarian mummery of Official Science putting science and scientists into conflict with policy. What do they say? What they know (polar bears aren't in danger)? Or, what they're supposed to say? Climate hysteria has loaded a wide range of scientific subjects, journals, scientists, and professional societies with this dilemma. Go with the politics, be a "player" - or stick to the science? As scientists, what do we traffic in: authority, or knowledge?

The Bushies seem to think this will mollify some people, but without giving the environmentalist wackos a powerful new legal lever to start demolishing industrial civilization in the US. Here again, we see a breakdown of governmental sovereignty, how government's power, especially under a weak president, becomes fragmented, taken over by narrow interest groups, and abused at the expense of society as a whole. The situation is frightening, opening up a limitless dictatorship over everyday life by environmentalist and legal fanatics.

Labels: , , , , ,

Tuesday, May 27, 2008

Escape from the greenhouse

What is a greenhouse? Is the Earth's climate a greenhouse? Why are infrared (IR)-opaque gases misnamed "greenhouse" gases?

What is a greenhouse? A greenhouse is an environment artificially controlled to maintain equable conditions of temperature and humidity suitable for growing plants in colder and highly variable climates. It's a controlled "climate box."

There is one source of heat in the Earth's lower atmosphere (visible and ultraviolet radiation incoming from the Sun) and three means by which the radiation, converted to infrared, can escape upward. In one case, it remains IR radiation and escapes as such. In the other two cases, convection and evaporation, the IR radiation is converted to a form of heat in matter (air and water vapor) before it moves upward. The first mechanism is, by itself, easy to understand and straightforward to control. The other two are much harder to either control or understand.

What a greenhouse does is to put a lid on the escape of heat through convection and evaporation. These two upward heat flows are trapped and turned back downward. OTOH, a greenhouse allows radiation in and radiation out unimpeded or only mildly controlled. Because radiation flow is easy to control, conditions in the greenhouse - temperature and humidity - can be regulated with a fair degree of accuracy. That's the point of a greenhouse. The walls of a greenhouse also put the kibosh on winds, shutting off another source of climate variability.

Is the Earth's climate a greenhouse? No. A greenhouse is close to a "pure radiative heat transport" situation. The Earth's climate is strongly influenced by the other two heat flow mechanisms and can't be considered a greenhouse, even as an approximation. Greenhouses are built because the Earth's climate conditions are not equable, especially in temperate regions that experience large daily and seasonal swings of temperature and humidity. The closest natural situation on Earth to a greenhouse is the tropics, and even there conditions vary a lot over the year. Upward heat convection and evaporation are, if anything, stronger in the tropics than elsewhere.*

But there's a deeper point. As concentrations of IR-opaque gases rise, they put a larger obstacle in the way of heat escaping from the surface as radiation, but they do nothing directly to affect the other heat flows (convection and evaporation). IR-opaque gases don't make the Earth's climate more "greenhouse-y" in fact. To do that would require strong limits on the other forms of heat transport, just as a real greenhouse does. But the IR-opaque gases modify the radiative heat flow - the opposite of a greenhouse.

Why the "greenhouse" effect and "greenhouse" gases? A posting last year discussed the origins of this misguided metaphor in both popular and scientific misunderstandings about heat transport from a century or more ago. In 1909, English scientist R. W. Wood proved that greenhouses don't "trap" radiation - quite the contrary.

Unfortunately, the bad metaphor stuck in decades of popular books and scientific texts on climate. Climate and weather books often flag the faulty double metaphor (greenhouses don't "trap" radiation, and the Earth's climate isn't a greenhouse anyway). But most scientists have given up on trying to fix it. Some books use other metaphors as catchphrases and mneumonics, like "atmosphere effect," for what is in fact a complex series of heat flow constrictions and diversions. Last year, I used the fairly exact analogy of a constricted garden hose.

The "greenhouse" and "greenhouse gas" language is fallacious through and through. Now that they have contributed to the rise of the "global warming" hysteria, these runaway bad metaphors have done far more damage than anyone could have imagined 50 or 100 years ago. The related bad metaphor of "heat trapping," rarely stated in explicit form, also lurks in the background and adds to the confusion.

A lesson from greenhouses about control and predictability. Armed with a correct understanding of greenhouses and why Earth's climate isn't one, we can see that greenhouses exemplify a very important point about control and prediction of climate.

Greenhouses have a steady climate inside because they're "radiation boxes." Radiation transport is the simplest part of the climate problem and, by itself, the easiest to predict. That's why greenhouses work: they rely on "radiation in-radiation out" only. Part of the trick of greenhouses is that they also shut off (or strictly confine) the other, "wilder" parts of climate, convection-turbulence and evaporation-condensation. If these forms of heat flow were allowed to roam wild and free, the temperature and humidity in the greenhouse could be not controlled or predicted. That would destroy its purpose and make the greenhouse no different from the general lack of predictability and control in the atmosphere - the real weather we face every day.

To paraphrase Foster Morrison again, the degree of isolation controls the degree of predictability. That's especially the case when climate has two parts wildness (chaotic-turbulent convection and evaporation-condensation) to one part easy (radiation). A greenhouse isolates a small piece of the atmosphere from the larger wildness outside and allows that piece to be heated and cooled by a steady and thoroughly nonchaotic flow of radiation.

The Earth's climate as a radiation box. It might be objected that viewed from the outside, the Earth's atmosphere is a radiation box. After all, there's no air or water vapor in outer space, so radiation is the whole game. Radiation flows in, and only radiation flows out. That's correct, but it doesn't make the Earth's atmosphere a greenhouse.

The ultimate reason is one of relative scales. In the Earth's atmosphere, the scale of convective heat transport is tens or hundreds of meters; the scale of evaporation and condensation (as clouds), a kilometer or so. The latter is six to 12 times smaller than the height of the lower atmosphere, the former 20 to 100 times smaller. There is no sense in which the Earth's atmosphere as a whole can be viewed as a single greenhouse - it's too big. It can fit many, many greenhouse-sized boxes. But none of these imaginary boxes would be closed; they would have to be open to air and water flows and thus not greenhouses. While they would have the right size, they would not function as greenhouses, which work because they isolate a small piece of atmosphere from the rest.

Without being closed to air and water flows, such imaginary would-be greenhouses couldn't act as greenhouses, with all their steadiness and predictability. And, because of its size, neither can the atmosphere as a whole.

POSTSCRIPT: Freeman Dyson, one of the last representatives still alive from the heroic mid-century era of physics, writes about "global warming," carbon dioxide, and plants in the New York Review of Books.
---
* Thus the troposphere-upper atmosphere boundary is highest in the tropics, because of that strong upward "push." Upward convection and evaporation are weakest in the polar regions, and that same boundary is low over the poles, sometimes (during the polar winter) almost touching the surface ("sky falling to the ground").

Labels: , , , , , , , ,

Friday, April 25, 2008

Just passing by

The past year: snow, ice, and cold. Even Baghdad had its first snow in centuries this past winter, something I was unaware of.

Ice ages everywhere. There's some confusion here about "ice ages." The possible solar variability-driven cooling they're talking about is a "mini" or "little" ice age, like the Little Ice Age of 1350-1650 (with lingering aftereffects until the mid-19th century). It means a possible cooling of maybe 1 oC averaged over a year, perhaps a little more. (That's a noticeable change.) A real ice age results from the combination of astronomical changes (in Earth's orbit and spatial orientation) and movements of the continents. The continents are and have been in place for many millions of years; the astronomical conditions come and go. We're not due for it in the near future. Real ice ages mean temperature drops in polar and temperate regions of 5-7 oC up to 10-12 oC. These are much bigger than what's apparently caused by solar variability.

The Sun will have its say. Interestingly, the new NASA solar variability model is predicting a "strong" solar maximum in a couple years. Their new model is another one of those simplified and approximate models used in place of the full theory of solar magnetism, which is far too hard to solve. (Also, no one knows enough about specific conditions in the Sun to even state the full theory properly.) The model is "semi-empirical," which means its uses a mix of some theoretical principles with a lot of analysis of past solar cycles (just like weather prediction on Earth). Its validation is "retrodicting" past solar cycles, but that's not a controlled laboratory test. It's really educated guessing, because it's all we've got. OTOH, the sunspot cycle right now, as observed, seems exceptionally weak, although we've just passed the minimum. In any case, the correlation between Earth temperatures and solar magnetic activity continues to hold up very well, as it has for decades and centuries.

The fading "consensus." The notion that there is a "scientific consensus" on "global warming" - that apocalyptic worldwide warming due to human-emitted infrared-opaque gases is happening, has recently happened, or will soon happen - is a fraud. There's a wide range of opinion on the subject among scientists, shaky (at best) empirical basis for the belief, and scant theoretical basis either, apart from slipshod and mistaken analogies. In climate and closely-related sciences, the "global warming" fanatics are and have always been a small if loud and aggressive minority. Many fencesitters are beginning to grasp the magnitude of the hoax.

These books are more signs that the "consensus" is coming apart:
Contrary to the cult propaganda of Al Gore, these are voices of reason, facing a politically-motivated and imposed pseudoscientific fantasy pushed by vicious environmental activists, demagogic and bullying politicians, and unhinged ex-scientists, then incessantly repeated 24/7 by ignorant journalists.*

(Hat tip to Instapundit.)
---
* You can see examples of the vicious fanaticism of the enviro-wackos on the Web, with reviews that repeat non-facts (formerly known as "lies") about the authors of these books.

Labels: , , , , , ,

Wednesday, April 16, 2008

Cycles of climate: The Sun

Most stars are variable. Their large variability in total luminosity (watts of output, summed over all wavelengths of electromagnetic radiation) is often due to internal heat cycles, similar to the Earth's internal climate cycles, but on a far grander scale. (Stars are thousands of times bigger than the Earth.) Another, less dramatic but still important, form of variability is due to stellar magnetic fields and magnetic cycles. The Sun is a variable star of this magnetic type. Right now, it is unusually stable compared to similar stars with similar magnetism. But that was probably different in the not-too-distant past - and almost certainly will be different in the not-too-distant future. It's essential to realize that the Earth's climate is not a closed system, but mingles high above our heads with various emissions (electromagnetic radiation, magnetic fields, and charged plamsa) from Sun.

Time scales of climate change. The climate cycles in a previous posting were multiannual and multidecadal, observed by modern scientists with modern instruments. But the paleoclimate record, embodied in proxies such as sea corals, tree rings, gas bubbles trapped in bogs and ice, and much more along the same lines, shows clear signs of longer-term cycles. Historical records made before the arrival of modern scientific instruments in the 19th century are also of value here. A thousand years ago, grapes grew in Britain and southern Greenland was pretty hospitable - it wasn't all just Viking propaganda :)

If we zoom out to the time before the rise of civilization or modern humans, we come to the time scale of the Ice Ages, running from tens of thousands to tens of millions of years. Previous postings (here and here) already discussed the Ice Ages and how they're controlled by a combination of astronomical cycles and movements of the continents. The astronomical part controls the timing of the Ice Ages; and the continental positions and the related poleward ocean currents, their intensity. Infrared-active gases like carbon dioxide and methane are minor to unimportant.

Between the one-to-10-year and the 10,000-to-10-million-year range, we have three "log decades" or "powers of ten" (101 to 104 years). There are probably subharmonics of the internal Earth climate cycles lurking here, with lower frequencies and longer periods.

The central importance of the Sun. But when you think "global climate," the first thing that ought to come to mind is the Sun, not something humans are doing. The Sun is the one major influence that affects all of climate everywhere simultaneously. The paleoclimate proxy evidence on this score is very strong.

The mother of all ups-and-downs on centennial and millennial time scales is solar magnetism. This related bundle of cycles has so many impacts on the solar system and the Earth, it would take a whole book to spell them all out, and just at a fairly non-technical level. Here's a whirlwind tour in one large posting.

Solar magnetism: Its effects on the Earth.
The Sun's magnetism varies on a roughly 22-year complete cycle, with shorter-term irregular "flickerings" and longer-term, low-frequency subharmonics. The most dramatic effects people see on Earth are a result of the "space weather" that solar magnetism stirs up. At solar magnetic maxima, intense solar storms slam large ejections of rarefied, magnetized hot plasma into the Earth's own magnetic field, setting off upper-atmosphere auroras in polar regions and messing with electrical and electronic equipment worldwide. Astronauts have to go back inside or just come home, to protect themselves from the intense flux of solar plasma. Anything depending on terrestrial magnetism can be knocked a-kilter: humans (if we use a compass), and birds and dolphins (they have small magnets in their brains for navigation).

The last solar maximum occurred in 2000; the one before, in 1989. You can learn more about space weather here.

Solar magnetism: Its origin and nature. Most stars have significant magnetic fields that arise from the circulation of charged particles in their rotating hot plasmas. (The Sun rotates about once in 26 days.) For reasons still not completely clear, the Sun's magnetism, which is roughly laid out like a bar magnet (north and south poles), switches magnetic polarity roughly every 9.5-11 years and completes a cycle every 19-22 years. The hot solar plasma interacts with this magnetic field near the surface, becoming entrained in the magnetic field lines. In the outermost (transparent) solar atmosphere, the plasma pressure is not fully balanced against gravity, and a hot, thin plasma solar wind blows outward, taking magnetic field lines with it. Its speed and particle flux are 400 to 750 kilometers per second and about 100 billion particles (charged ions) per second per squared centimeter. The density is typically 5-10 particles per cubic centimeter, although in a massive eruption, the density and flux can be 10 times their "normal" values. This is pretty rarefied compared to our environment, but still far from a true vacuum.
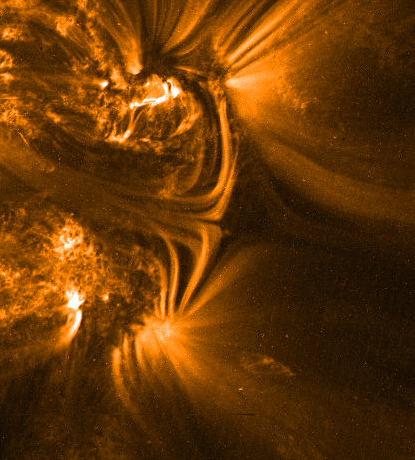
The Earth's own magnetic field (magnetosphere) generally protects us from the solar wind - but not entirely. When the Sun switches magnetic polarity, the solar wind is interrupted repeatedly by massive ejections of hot, magnetized plasma. These mainly occur near the solar rotational equator, which is close to the Earth's orbital plane. The Earth is subject to some of these magnetic plasma ejections. During this phase of the cycle, the strength of the Sun's magnetic field near the surface reaches a maximum.

Solar magnetism: More stuff happens. The most visible result of this intensified solar magnetism near the surface is sunspots. Other stars, rotating and magnetized, have them as well, and also exhibit a periodic rise and fall in their magnetism and starspots. Sunspots are places where the field near the surface pokes out, forming partial field loops that connect paired spots (one N, the other S, polarity).

The best proxy for solar magnetic intensity, it turns out, is not the number of sunspots, but a combination of the total area the spots cover and the magnetic cycle period length. Strangely, while the centers of the spots are indeed darker than the surrounding solar surface, the areas near the spots (the faculae) are actually brighter. The net result is that, for our Sun, solar magnetic maximum is also a solar brightness maximum; solar magnetic minimum, a brightness minimum. Comparing one cycle to another, a solar maximum is stronger if the associated cycle is shorter; weaker if longer.*

Solar brightness, total and differential. The Earth's upper atmosphere. The solar brightness has varied by somewhat less than two-tenths of percent over recent solar cycles. Using a rule from radiation thermodynamics, the surface temperature of the Earth should, naively speaking and ignoring any complicating mechanisms, vary as ΔT/T = ΔB/(4B). So a few tenths of a percent in solar brightness B (ΔB/B ~ 0.002) might give rise to about a tenth of a percent variation in the Earth's surface temperature. For T(E) = 288 oK, that's ΔT(E) ~ 0.15 oK, small but not negligible. It's a factor of a few off from predictions of semi-realistic "global warming" scenarios that include the effect of enhanced clouds and convection. And indeed, Fourier-analyzing temperature variability does result in a harmonic spectrum that includes, among other features, a suspicious peaks near 1/11 inverse years of frequency. Years with solar maxima do tend to be hot and dry.

And Nature has a further trick up her sleeve. While the solar total luminosity doesn't vary much, the ultraviolet (UV) part of the spectrum varies disproportionately over the solar cycle, by 10% or more, with "strong" solar maxima showing larger increases in solar UV. Its presence or absence over the daily cycle expands or shrinks the Earth's upper atmosphere and changes the ozone-rich boundary between the upper and lower atmospheres. This daily effect has been measured for over a century by its impact on surface air pressure. (See this old posting.) Without a fairly exact understanding of vertical heat transport in the Earth's atmosphere, it's hard to infer from this daily pressure variation the corresponding variation in the atmosphere's temperature distribution. Naively, it should be roughly 0.4 oK, and there are good reasons to think (see below) that the variation is enhanced by a factor of two to three.

What this means for the 11-year solar cycle is currently the subject of intense debate and investigation. Comparing our star to others similar to it, it's not unreasonable to think that it can exhibit (over centuries and millennia) larger brightness variations than seen in the last 30 years of satellite measurements. Combined with enhancement within the atmosphere (especially from the lowering and raising of the ozone "lid" on the lower atmosphere), there's a clear implication that even small variations in solar brightness can have noticeable effects on the Earth's surface.

The solar wind and cosmic rays: Maybe it does something to the clouds. An idea more difficult to evaluate is rooted in another side-effect of the solar wind. The wind strengthens during solar maximum and weakens at solar minimum. Outside the Sun's magnetic sphere of influence (the heliosphere), which extends out to roughly 90 Earth orbital radii (8 billion miles or so from the Sun), is the interstellar medium and a very rarefied flux of extremely energetic charged particles called cosmic rays. (More rarefied than the solar wind itself: the cosmic rays are one particle per cubic centimeter). They're mainly protons (hydrogen nuclei). The solar wind keeps many of them out of the inner solar system, but not all.**

Most of Earth's clouds form, not by spontaneous condensation of pure water droplets (which is a pretty slow process), but by nucleation, water droplets glomming on to other particles floating in the atmosphere, mainly dust and aerosols. This catalyzed or induced condensation is much easier than for pure water droplets and the main reason we have clouds.

What does that have to do with cosmic rays? When they hit the Earth's upper atmosphere heading toward the surface, they leave behind a trail of ionization, temporarily charged atoms - air molecules that are temporarily stripped of some electrons. Such trails are perfect nucleation sites for water droplets or crystals to form.

When the solar wind is weaker, more cosmic rays get through and (maybe!) induce more water condensation in Earth's atmosphere: more clouds, less sunlight, lower surface temperatures. When the solar wind is stronger, the opposite might happen.

The ups and downs of the flux of cosmic rays hitting the Earth's atmosphere is established, for the era prior to scientific instruments, with the formation and deposition of beryllium-10 and carbon-14 in ice and organic material. These radioactive variants (isotopes) of the standard elements (beryllium-9 and carbon-12) are tracers of the strength of the cosmic rays that produced them.

The Sun's variability affects the Earth's climate. We can summarize all of these effects in a little table.
Sol         Sunspots    Solar brightness    Cosmic rays    Clouds        T(E)
magnetism (total area) (total and UV) at Earth
-------------------------------------------------------------------------------
Up Up Up Down Down (?) Up
Down Down Down Up Up (?) Down
The evidence for significant solar modulation of Earth's climate is indirect but compelling. Every index of climate (temperature, pressure, clouds, and rainfall) shows a component in its variability with the solar magnetic cycle period (9.5-11 years). When we consider the more irregular flickerings of solar brightness over shorter time scales (months to a few years), the connection can be brought down to the level of specific events and timings. Statistical tests of significance consistently yield correlated variability between solar and climate variation at 50-80%.†
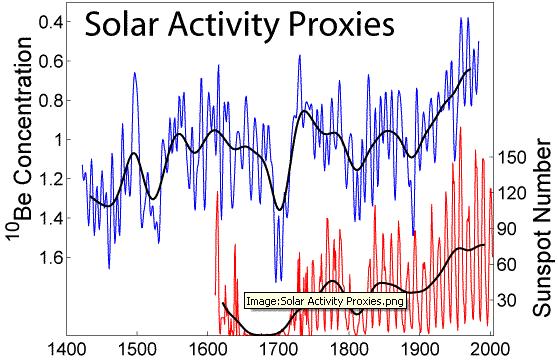
And there's compelling history too. Paleoclimate records exhibit a tight connection between cosmic rays and climate proxies. The solar magnetic cycle is itself modulated over much longer times by irregular waves of weaker and stronger solar maxima. The Sun was exceptionally active during the Medieval Warm Period (c. 800-1300) and exceptionally weak during the Little Ice Age (c. 1300-1650), with reported sunspots and reconstructed cosmic ray fluxes correlated in just the way expected from the little table above.††

And where's "consensus" science? You might think this would be an area of active research, with lots of scientists swarming all over it. There has been a lot of work on the Sun-Earth connection since it was first suspected in the 19th century. Interest faded in the 20th century, at least until the 1970s, with the arrival of satellites and the first successful paleoclimate reconstructions.

But there's not enough research in this area. From the point of view of how the sciences are presently divided up, it's highly interdisciplinary and causes suspicion because it crosses so many academic boundaries. And in the last 20 years, of course, we can't escape the bad effect the "global warming" hysteria has had in discouraging scientists and redirecting research funding away from such work. Citing early, limited, and poorly executed statistical studies, the IPCC has repeatedly dismissed the connection, for no good scientific reason. The scientific annexes of the IPCC reports do mention the connection and regard it as important, "poorly understood," and deserving of more research. But that sound scientific advice has been ignored: it's not "with the program."

See here, here, and here for some recent developments in the saga of solar variability affecting - not the Earth - but Mars and Neptune. No industrialization out there: another demonstration of how little we understand climate.

References

Caution with some of the amateur Web sites out there on this topic. Opposing the fake "consensus" theory of "global warming" due to (the misnamed) "greenhouse" gases, their heart is often in the right place. But they're often sloppy with their science. Much more reliable are the three climate blogs linked at right in the blog roll.

= D. V. Hoyt and K. H. Schatten, The Role of the Sun in Climate Change, Oxford U. Press, 1997.

= B. Fagan, The Little Ice Age, Basic Books, 2001.

= W. W.-H. Soon and S. Yaskell, The Maunder Minimum, World Scientific, 2004.

= S. Baliunas, in Shattered Consensus, P. J. Michaels, ed., Rowman & Littlefield/George C. Marshall Institute, 2005. Short, semi-technical survey of current knowledge. Stresses both the evident empirical reality of solar modulation of climate and our poor theoretical understanding of it. The scientific annexes of the IPCC reports are not that different in spirit.

= S. F. Singer and D. Avery, Unstoppable Global Warming, Rowman and Littlefield, 2006. Identifies the MWP and LIA as part of a long-period (1500-year) modulation of the solar cycle attested by hundreds of thousands of years of climate proxies in ice core samples.

= Streaming video of a talk on solar physics basics by astrophysicist Kelly Korreck at the Harvard-Smithsonian Center for Astrophysics, February 2008 (see this page).

---
* It can be, and is, different with other stars. In some stars, more spots lower the brightness, overall. Their magnetic cycle periods are also not rigidly constant, but vary within a range, from one cycle to the next.

Sun-like stars with similar magnetism typically show brightness variations larger than currently seen on the Sun, a few tenths of a percent, up to about a percent.

** To clear up a frequent confusion: scientists today refer to these galactic cosmic rays as "the" cosmic rays. They have individual particle energies in the 100s of millions of electron volts (100s MeV) to a few billion electron volts (GeV). They probably originate from our Galaxy's cumulative history of supernova explosions.

In older publications, the solar wind particle flux was sometimes referred to as "cosmic rays" as well. These particles have much lower (although still pretty large) energies, roughly 10 to 1000 electron volts (10 eV to 1 keV). These are typical of the energetic X-ray emissions from atoms, and the particles are accelerated by mechanisms that transfer comparable energies. A typical atomic transformation in everyday chemical reactions is one to 10 electron volts (1 to 10 eV), by comparison, up to a thousand times smaller than the solar particles and a million to a billion times smaller than the galactic particles.

† That is, both phase and frequency information are available and are closely correlated, not just frequency information. See Scafetta and West (PDF). Wavelets (a mix of time- and frequency-domain analysis) are a better way to analyze this than pure Fourier analysis. Typically significance is tested with nonparametric methods like principal component analysis.

†† Very large sunspots were noted on the Sun's surface at that time by Chinese astronomers who, unlike their European counterparts, were not prejudiced into thinking that a heavenly body has to be "perfect." Without telescopes, they observed the sunspots at sunrise through thin clouds. Earlier naked-eye sitings date back to antiquity.

The rise of telescopic astronomy in western Europe in the 1600s marked the beginning of more controlled observation of the Sun. But as luck would have it, that happened in the later part of the Maunder Minimum, a dearth of sunspots - and very cold Earth temperatures (Little Ice Age). Over the last 450 years, the Earth has been recovering from the LIA, although the recovery has been interrupted by several, less severe, sunspot minima.

Ironically, there has been some resistance among climatologists to accepting the fact that the Sun is a variable star. The Sun's input of electromagnetic radiation to the Earth's climate is sometimes called the "solar constant" (about 1370 watts per square meter). Discovering that the "solar constant" isn't really constant was like discovering in the 1600s that the Sun isn't an unblemished celestial orb.

Such language confusion, like the use of climate "anomaly" and "forcing" - which have precise technical meanings and don't necessarily mean something bad is happening - is one cause of climate hysteria. Platonism has been dying a long time in the sciences of the West, and it's sustained by both popular and elite misunderstandings of this type.

Labels: , , , , , , , , ,

Monday, April 14, 2008

Cycles of climate: The Earth

One way of understanding "climate" is to think of change on time scales longer than the strictly periodic cycles of the day and year set by the rotation and orbit of the Earth. Familiar to everyone, yet usually unrecognized in their true nature, the multiannual oscillations of the coupled oceans and atmosphere possess periods up to 10 years or so, and longer in some cases. Much of what is wrongly attributed to "global warming" is in fact due to these cycles and their longer-period subharmonics.

Oceans as reservoirs and convectors of heat. These oscillations take longer than seasonal and daily changes in the atmosphere, in part, because the oceans possess a much larger heat capacity than does the air. The cycles rely on a "heat reservoir" effect. Oceans have high "thermal inertia" and take a long time to absorb and release their heat. Each cycle, moreover, while grounded in a particular geographic region, also affects heat, wind, and humidity circulation worldwide. While they can be thought of in terms of local thermodynamics (pressure, temperature, humidity, precipitation), it is more illuminating to think of them in terms of flows. Pressure differences give rise to winds; temperature differences, to both winds and heat flow. These in turn determine evaporation rates, cloud cover, and precipitation. The geographic shape of these oscillations is determined by how oceans are contained by the continents. The bigger the ocean, the bigger the impact of climate oscillations.

For unto us a child is born. The best-known is undoubtedly the El Niño-Southern Oscillation (ENSO), which stretches over the South Pacific from Indonesia and Australia in the west to the west coast of South America in the east. The basic cycle takes about three years, although some cycles are irregular and can last up to seven years. The changes in the atmosphere are most commonly tracked by watching oscillations in air pressure, rather than temperature. (Recall these are related by the ideal gas law: pressure proportional to the product of air density and temperature.)

The cycle starts with La Niña conditions: easterly trade winds near the equator* blowing westward and piling up warm water in the southwest Pacific. Off the west coast of South America is, the water is colder, fed by an upwelling of cold water from the depths. These upwelling waters are loaded with nutrients and, in such years, support some of the richest fishing grounds on the planet. The air temperatures are also cooler at the eastern end and support less humidity and rainfall on the western slopes of the Andes. Conversely, Indonesia and Australia experience heavier rains in those years.

As the El Niño pattern develops, the easterly trade winds slacken off, allowing warm water to move back to the southeastern Pacific, weakening the cold-water upwelling off the South American coast. These are bad years for fishermen there; the food flow for fish near the surface slows. They are also years of heavy rains in western South America. Conversely, they are years of frequent drought in Indonesia and Australia.

Like all such internal climate cycles, ENSO is fundamentally a coupling of a broad expanse of ocean of the atmosphere above it. The basic time scale is set by the transfer of excess ocean heat from the southwestern Pacific to the southeastern and back, with related changes in ocean currents and more or less slaved changes in air temperature and winds.

ENSO has global impact and, because the Pacific is the largest ocean, is the most consequential oscillation in the Earth climate system. Some of the excess heat in the southeastern Pacific "leaks" north and eastward, changing seasonal temperature, cloudiness, and rainfall patterns in North America and over the Atlantic. The absence of such excess heat also impacts climate elsewhere.

Other climate oscillations. Tropical storm tracks and changes in the Asian/Pacific Arctic. Other, smaller oceans have their own local versions of the same phenomenon, cycles of excess heat traveling back and forth in ocean basins. Affecting North America and (especially) Europe is the North Atlantic Oscillation (NAO), which is tightly linked to the Arctic Oscillation. Years of strong westerly winds blowing eastward across the Atlantic lead to milder summers and winters and more rain in Europe. These strong westerlies also deflect Atlantic tropical storms eastward and keep them from making landfall. Weakened westerlies lead to more extreme temperatures (colder winters and hotter summers) and European droughts. Tropical storms face less of an obstacle to keeping their tropical westward tracks as they move away from the equator; they are much more likely to make landfall or end up in the Gulf of Mexico, where they are renewed in strength from the warm, shallow waters.

The recent period from 1999 to 2005 was a period of increased incidence and landfall of hurricanes. The North Atlantic westerlies were weak. Europe experienced hotter summers, colder winters, and less rain. The last two years have seen the cycle shift back the other way.

A more recent discovery is the long (10- to 30-year) Pacific (Inter)Decadal Oscillation (PDO), which actually seems to be a collection of several interlinked oscillations cycling at multiple periods. The last decade has seen a warmer west Pacific, which is probably tied to the retreat of Arctic ice cover at those longitudes.** Such retreat has not been seen on the Atlantic/European side. It's local warming, not global.

The oscillations are linked and sync'ed. Considered as a whole, the Earth's climate features all these regional cycles oscillating simultaneously. Their periods are not commensurate, so their collective pattern, while containing repeating elements, does not repeat as a whole. Each moment in the collective system is unique.

Furthermore, moving to the forefront of climate research, we should take note of the apparent fact that the different oscillations, being coupled to one another, get into sync, out of sync, then back into sync in a different way, never exactly repeating. The oscillations are subject to longer-period modulation, with some cycles, for example, of ENSO being stronger and others weaker. When all the oscillations are simultaneously strong, hemispheric or super-hemispheric inter-oscillation "locking" is especially enhanced.

Such a "locking" evidently happened in 1977 and again in 1998, changing the global evolution of air temperature, pressure, and humidity, as well as the exchange of heat between air and oceans. These years were apparently the start and end of the most recent warming period globally. More research is needed to expand the knowledge base of these oscillations worldwide and get a more complete picture. But the "global warming" hysteria slows down such fundamental research and generates "manufactured ignorance" about climate, in place of discovery of new knowledge.

POSTSCRIPT: Over to the right, you'll see some new climate blog links: Steve McIntyre's ClimateAudit, the wonderful plants growing over at CO2 Science, and the venerable World Climate Report.
---
* Remember the prevailing latitudinal wind patterns? See this old posting.

** It's ocean warmth that is the primary melter of ice, not warm air. The North Pacific ocean currents run west to east and "leak" some warmer water into the Bering Straight area. The main branch of the same current runs down the west coast of North America. It's much colder than the summertime air temperatures over temperate zone land, giving rise to strongly enhanced condensation and some famous fogs - a giant air conditioner, essentially.

Labels: , , , , ,

Monday, April 07, 2008

Oh god, she's done it again ... :)

Our polar correspondent, Jen of Nunavut, after a long, hard winter, joins the Inuit in doing more un-P.C. things with polar bears.

Labels: , ,

Tuesday, October 30, 2007

Now we know who's coming to dinner

Now I've done it: my Nunavut correspondent has decided to go all the way with polar bear meat. I feel somehow responsible - hope it was good :)

POSTSCRIPT: Bears hunting humans, humans hunting bears ... somehow, it all evens out. It's part of the circle of life :)

Labels: , ,

Friday, October 26, 2007

Guess who's coming to dinner?

So here's the rest of the story about polar bears (ursus maritimus), the parts never mentioned on the boob tube.

A warming of the Arctic (at least a mild warming) would be a boon for the bears, since they range mostly over land and feed on aquatic creatures along the shore, like fish and seals. Less ice -> more food for the bears. The warming trends are ambiguous: no sign of ice loss or warming on the Canadian/Greenland/Atlantic/European side; some signs on the Asiatic/Pacific side.

The Inuit (Eskimos) of the Arctic are permitted by the US and Canadian federal governments to hunt polar bears, to an extent. Polar bears are not currently listed as endangered - for one thing, their population is increasing. It's not clear to me why that is. The Inuit population of the Canadian north is increasing rapidly. With more humans, there's a lot of trash 'n' stuff for bears to feed on, and they, like their more southerly brown and black bear cousins, have definitely lost their shyness around humans. They routinely come to town looking for, and finding, things to eat. Right now, there's no reason whatever to think that polar bears are in any long-term danger.*

Environmentalists and the media systematically ignore or hide the full truth about polar bears. They are incredibly dangerous to humans, and anyone living in the north is permitted to shoot and kill them in self-defense. Such shootings run at a few hundred a year. Unlike their temperate cousins, polar bears hunt humans for food. The reason is simple: polar bears hunt seals for food - seals are soft, hairless, and blubbery, and make a fine extended meal. Humans are soft, hairless (mostly), and blubbery too.** Not for nothing are polar bears referred to as "land sharks." (For an example, see here.) Read more about them here from a Canadian living in the Arctic.

Posters like this are common in Nunavut, the Canadian province newly created from the Northwest Territories for the Inuit. The strange symbols are a modern alphabet for the Inuit language. A polar bear wandering through town was recently shot dead in Cape Dorset (Baffin Island) by a teenage Inuit boy.

The Inuit are permitted to turn polar bear skins into pelts, blankets, and rugs. Hunting tags are free for them. For outsiders, they cost about $30,000. There's some trade in these items, although restricted by both US and Canadian law. A full polar bear skin costs about $20,000.
---
* Endangered means population below a certain size and greatly shrunken habitat. The polar bears are not close to this. The doomsday scenarios are hysteria built on speculation built on hysteria. The "global warming" craze as a whole resolves down into many such deceptions and half-truths.

** Which just adds one more support for the "aquatic ape" theory about humanoid ancestors - even though most biologists don't like the theory or aren't even aware of it. Do polar bears know something biologists don't?

Labels: , , ,

Tuesday, September 18, 2007

As the glacier turns

A supposedly decisive indicator of the reality of "global warming" is the supposedly melting Arctic and Antarctic icecaps. Certainly a rigorous thermodynamic deduction implies that polar temperatures should increase more than equatorial ones, leading to less ice up there and down there. The ice caps should shrink in both latitudinal coverage and in thickness. But the "global warming" case here, as elsewhere, falls apart upon closer examination.

The strongest and most worrisome trend is the apparently 30-year-long shrinkage of latitudinal ice coverage in the Arctic. But this trend is ambiguous. The shrinkage is all on the Asiatic side of the Arctic Ocean. The Canadian-Atlantic-European side shows no such shrinkage. There's no significant trend of shrinkage in Greenland. While there is some evidence of rising temperatures in the Arctic, the most characteristic expected trend - stronger warming in the winter, weaker warming in the summer, with a narrowing of summer-winter temperature differences - is absent. Nor is there any consistent trend of narrowing temperature differences between the equator and the Arctic, again something definitely expected from an infrared (IR) opacity-driven "global warming" scenario.

But it is when we turn to trends in the Antarctic that the "global warming" case fizzles. Temperatures there have been unambiguously falling for the last 30 years, not rising. There has been some thinning of the ice cap in the western Antarctic, but that seems to be due to lessened snowfall in the winter, itself apparently a result of cooling temperatures and a weakened evaporation-precipitation cycle. It's exactly like the case of the retreating ice cover on Kilimanjaro.*

For a small warming, we should not necessarily expect lessened ice volume. The ice coverage by latitudinal area would definitely decrease, because the summer isotherms (curves of equal temperature) would move poleward. But slightly warmer summers and somewhat warmer winters mean more humidity and probably more snow. Ice thickness would probably increase in that case. What that means for ice volume (thickness integrated over area) is ambiguous.

For a larger warming, we should definitely expect net ice loss, averaged over a year, year by year. But in that case the main cause would not be rising air temperatures, but rising polar water temperatures. Water takes longer to heat up than does air. But once heated, water is a huge heat reservoir and much more effective at melting ice than warmer air.

The amount of IR-active gases in the Earth's atmosphere is in any case too small to be the dominant driver of the ice cap coverage. The caps are reminders that we're technically living in an Ice Age. Before a few tens of million years ago, the Earth's poles were ice-free and the Earth's general climate was quite a bit warmer. The basic mechanics of permanent ice caps has to do with the position of the continents and the partial or complete blocking of the poleward ocean currents that move excess heat from the tropics.** The timing of ice advance and retreat is driven by the Earth's orbital and orientational variations (Milankovic cycles). IR-active gases, as far as anyone can tell, are at most a footnote to this story.
---
* Again, another reminder: climate = temperature and humidity/evaporation-precipitation as two (at least) independent variables, not just temperature!

** Quick sanity check: The most cooling possibility is a landmass over top of a pole. The second most cooling possibility is a landlocked polar ocean. For the present Earth, the Antarctic fits the former, the Arctic the latter. And indeed, the Antarctic is colder than the Arctic.

Labels: , , , , , ,

Tuesday, September 11, 2007

Hurricanes, typhoons, and cyclones: Variations

What impact would an infrared (IR) opacity-dominated climate ("global warming") have on cyclones, tropical cyclones in particular?

The tropical heat/moisture engine is modified. The basic features of an IR-opacity dominated climate are:
Putting back in turbulent convection and the hydrologic cycle gets us a few key compensating effects as consequences:
  • Enhanced vertical convection, moving heat upward more quickly and speeding up the air circulation "merry-go-round"
  • Enhanced evaporation, precipitation, and cloudiness
The air circulation "merry-go-round," on the largest scale, is just our friends, the Hadley cells. These will be enhanced in both speed and effectiveness of heat transfer. The earlier discussion of convection perhaps made it sound as if it is just a vertical, upward affair. It is for the heat. But the air, unlike the heat, does not escape the lower atmosphere. So there has to be some horizontal motion as an intermediate step between up motion and down motion. And there has to be compensating downward motion of cooler air, after it's given up its heat to the upper atmosphere, to preserve the overall mass of tropospheric air.

Consequences for tropical cyclones. If you think of the Second Law at work in the Earth's atmosphere by latitude, you realize that tropical cyclones serve the atmosphere's "need" to even out heat flow, overcoming the large difference between equator and poles and between high summer and autumn. If the temperature difference between poles and equator and between summer and winter narrows, even as the overall temperature goes up, the Earth's atmosphere has less "need" for tropical cyclones.

The specific mechanism that drives topical cyclones with excess heat and moisture is the nighttime temperature difference between the still-warm water and the cooler air.* "Global warming" will raise air temperatures more than it does water temperatures. Hence, the air-water temperature gap narrows, and the cyclone-driving "heat/moisture pump" is weakened. Some consequences of this change are difficult to trace out in full. But the essentials are unequivocal:
  • Poleward transfer of heat and moisture: reduced
  • Duration of tropical cyclones: reduced
  • Intensity of tropical cyclones: reduced
  • Frequency of cyclonic storms: hard to say, but an educated guess is: reduced
  • Poleward movement of tropical cyclones: enhanced by stronger Hadley cell and other convective motions
Overall, in a "globally warming" world, expect a (probably) reduced frequency of tropical storms, with each storm being less intense and shorter-lived, and moving more quickly poleward away from the equator.

Further thoughts on tropical cyclones. People living in tropical and subtropical areas obviously have a big stake in this question, and it's been manipulated and misrepresented by "global warming" fanatics eager to chase ambulances. In particular, whenever a major hurricane like Katrina or Rita hits a populated and developed area like the Gulf coast, we can expect more "global warming" hysterics. Little attention is paid to the big fact about hurricane-prone areas, that they're far more populated and developed now than they were 30 or 50 years ago. As a result, they will necessarily suffer more human damage when a large storm lands than they would have back then.

The irony of it all is this: more frequent, more intense, and longer-lasting Atlantic hurricanes are almost certainly an indicator of a summertime atmosphere that is cooling year on year. It's one piece of a growing body of evidence that the Earth's atmosphere, or at least the north Atlantic, has been cooling - in fact, since the late 90s.

Put simply, periods of warming (1920s and 30s; late 70s to mid 90s) are periods of reduced hurricane activity. Periods of cooling (late 1940s to mid 70s; since late 90s) are periods of increased hurricane activity. The reasons are just those spelled out above. An upcoming summary of the present climate situation will return to this point.
---
* As summer passes on into fall, the tropical air cools day by day faster than does the water. Recall that water has a much larger heat capacity than does air.

Labels: , , ,

Monday, September 10, 2007

Hurricanes, typhoons, and cyclones: Basics

Cyclones, anticyclones, and fronts. Near the Earth's surface, vertical convection often creates localized low-pressure areas where surface air is pulled in towards a center of exceptionally low pressure, rises strongly toward the tropopause, then flows aloft outward from the low-pressure center. Compensating such low(er)-pressure areas are areas of high(er)-pressure where air aloft flows toward an center of exceptionally high pressure, flows down toward the surface, then outward along the surface from the high-pressure center.

In the Earth's rotating frame, any vertical or north-south air motion is deflected by the Coriolis pseudoforce.
  • In the northern hemisphere, low-pressure systems are set spinning counterclockwise. In the southern hemisphere, they are set spinning clockwise.
  • In the northern hemisphere, high-pressure systems are set spinning clockwise. In the southern hemisphere, they are set spinning counterclockwise.
Low-pressure systems (marked by "L" on a weather map) are also called cyclones and often bring with them rain and strong winds. If they form, as they often do, over water or humid land, the strongly heated, rising air at their centers takes with it a lot of moisture, which condenses into large cloud banks that eventually dump their moisture as precipitation (rain or snow). High-pressure systems (marked by "H" on a weather map) are also called anticyclones. Their air is typically much drier than the air in a low-pressure system, being pulled from aloft. They compensate for the presence of cyclones not only with respect to horizontal air flows, but also with respect to angular motion. They ensure that the atmosphere has no net angular momentum.*

Cyclones can be broadly divided between those associated with weather fronts (see here for more about fronts) and independent storms. A weather front is a sharp boundary between two air masses, one typically colder and drier, the other typically warmer and more humid. A cold front is a front where the colder air mass is pushing the warmer air mass; a warm front, a front where the warmer air mass is doing the pushing. Where a cold and a warm front meet, a "hinge" forms that gets spinning (by the Coriolis force) and forms a "low." A weather front can bring its own precipitation and strong winds, driven by the temperature, humidity, and pressure differences across the front boundary.

Front-associated cyclones and anticyclones are dragged along by their fronts in a direction determined by the basic Hadley wind pattern associated with the climate zone in question. Fronts in the temperates are pushed eastward. In the tropics and polars, they are pushed westward.

Tropical cyclones. Independent cyclones form away from any front boundary and live out a typical lifecycle that strongly depends on latitude and season. Some form near the equator (0o lat) and, while still in the tropics, drift westward and (steered by the upper air tropical Hadley cell flow) away from the equator. Once they cross into the temperate zone, the prevailing eastward Hadley cell air flow takes over, and they reverse course to eastward, while continuing to move poleward.** Tropical cyclones are universally called "tropical storms." If they feature winds above a certain threshold, they are called hurricanes in the Atlantic (after the Carib storm god, Hurikán), and typhoons in the Pacific.

Tropical cyclones derive their power from upward convection of warm, moist air. They pick up this power at night, when the warmer nighttime ocean water dumps heat by upward convection into the cooler nighttime atmosphere. (Recall that during the day, the heat flow right over the water is downward, supplying the latent heat needed for evaporation - the daytime air temperature is higher than the daytime water temperature.) The longer they move over warm tropical water, they more powerful they get. They lose that power rapidly when they cross over land. The strong upward convection of warm, moist air at the cyclonic center, combined with the Coriolis force, gets the cyclone to spinning faster and faster, with a well-defined and relatively cloud-free vertical column of upward convection (the "eye" of the storm) whose walls have high circulating winds. If these winds exceed a certain limit, the storm is classified as a hurricane/typhoon. While Atlantic hurricanes can be spectacular and destructive, Pacific typhoons are typically stronger and more frequent, because the Pacific features a much larger region of unobstructed warm tropical water.

Northern hemisphere tropical cyclones form during the period June-November (from right after summer solistice to almost winter solistice), but mainly in August and September. It is during these months that the nighttime contrast between warmer water and cooler air temperatures is largest. The upward convection of warm, moist air is most enhanced in these months, leading to the highest frequency of storms and the strongest storms. In the rest of the year, conditions are not right for tropical cyclone formation. For southern hemisphere storms, shift by six months.

Extratropical cyclones. Independent cyclonic storms also form near the ±60o lat lines. They drift westward in the polar zone, but switch to eastward if they cross into the temperate zone. Depending on geography, they can become trapped and sit for weeks or even months before dissipating. They typically pull warmer moist air from the south, convert it to rain or snow, then dump it at higher latitudes. They play an important role in transferring moisture to subarctic regions and replenishing polar ice caps. At somewhat lower latitudes, they form the nucleus of long-lived springtime storm systems that can afflict the northeast American and Asian coasts.†

The basic driving force of these systems is the contrast between the warmer, moister air of the high temperate zones and the colder, drier air of the polar regions. This contrast reaches its maximum (in the northern hemisphere) in the middle to late spring (April to early June), exactly the period when these storms are most frequent and strongest. For the southern hemisphere, again shift by six months.

Poleward mass, moisture, and heat transfer. The overall effect of these moist and warm low-pressure cyclones is to help in the transfer of excess heat and humidity from the tropical zone towards the poles. There is no net mass transfer, but rather a conveyor belt where mass transfer evens out to zero because of the balancing of low- and high-pressure systems.

While poleward heat transfer in the atmosphere is not as powerful as it is in the oceans, the effect is still significant. The net heat transfer is a result of the fact that the net air flow is, rising at the equator and falling at the poles. The presence of three Hadley cells per hemisphere, rather than one, merely complicates the details. Poleward atmospheric moisture transfer is also crucial in maintaining polar ice and snow covers. Water is evaporated at lower, hotter latitudes and dumped as rain and snow at higher, cooler latitudes.
---
* That is, as seen by an observer rotating around the Earth's axis with the surface. As seen by an outside inertial observer, the Earth's atmosphere does have a net angular momentum associated with its overall rotating motion.

** If the temperate eastward air flow ("westerlies") is weakened, a hurricane can keep drifting westward, even as it continues to move northward. From the Atlantic, such storms get into the Caribbean Sea and Gulf of Mexico, where they can wreak exceptional havoc in a small confined area. Such storms also get new strength from the warm, shallow waters of the Gulf.

If the temperate "westerlies" are strong, OTOH, Atlantic hurricanes get strongly deflected back eastward once they get into the temperate zone. They can then miss landfall altogether. As they move over the colder north Atlantic waters, they rapidly lose strength.

† These include the famous New England-Maritime-Greenland "nor'easters."

Labels: , ,

Sunday, September 09, 2007

Atmosphere in motion: Hadley cells

A permanent, year-round feature of the Earth's current climate regime is the movement of warm air away from the equator and toward the poles, with the convective motion broken into a set of three distinct latitudinal bands or "cells", one set per hemisphere, for a total of six cells all told. These cells now carry the name of the British natural philosopher George Hadley who, in the 18th century, first described these cells and grasped the associated wind patterns that so influence weather at different latitudes and played a critical role for seafarers in the Age of Sail.

It's difficult to describe these cells in words and better to see them in pictures or, preferably, as dynamic animations. Here's a static picture. And here's a more detailed diagram.

The Hadley cells originate from the warm air that rises at the equator (0o lat), sinks at ±30o lat, rises at ±60o lat, and sinks at the poles (±90o lat). The basic north-south movement is:
  • Between 0o and ±30o lat, southward at the surface and northward aloft (tropical zone)
  • Between ±30o and ±60o deg lat, northward at the surface and southward aloft (temperate zones)
  • Between ±60o and ±90o deg lat, southward at the surface and northward aloft (polar zones)
The consequence is a permanent tendency to form low-pressure systems at 0 and ±60o lat and high-pressure systems at ±30o and ±90o lat. Tropical cyclones (such as hurricanes and typhoons) form close to the 0o lat line, while subarctic (extra-tropical) cyclones form near the ±60o lat lines.

Now add in the effect of the Earth's rotation and the resulting Coriolis force (or pseudoforce, a feature of rotating, noninertial reference frames). Poleward motion at the surface is deflected eastward, while equator-ward motion is deflected westward. This causes the basic wind patterns we see at the surface: "westerlies" in the temperate zones (coming from the west, but headed east - I know that's confusing) and "easterlies" in the tropical and polar regions (coming from the east, but headed west). Hence, in the temperate zones, weather systems tend to move SW to NE in the northern hemisphere and NW to SE in the southern. In the polar and tropical regions, weather systems tend to move NE to SW in the northern hemisphere and SE to NW in the southern.

The Hadley cells, together with the Coriolis force and seasonal cycle, explain most of what you need to know about geographic weather patterns. The calm region of high-pressure, sinking air at ±30o causes the "horse latitudes," where ships in the Age of Sail were becalmed from lack of wind and had to throw their horses overboard to conserve on water. The tropical easterly "trade winds" were discovered and exploited by Columbus and other European explorers in the Age of Sail as the basic means of getting east to west, while the temperate westerlies (familiar to us living in the North America and Europe) were the basic means of getting west to east.

Local weather phenomena near the surface tend to move SW to NE in the northern temperates. But weather systems with strong vertical structure move NW to SE in the same latitudes. The controlling flow (steering wind) in such cases is the southward Hadley flow aloft, not the northward surface flow.

Hadley cells on other planets. The terrestrial inner planets Venus and Mars also feature atmospheric convective cells. Venus' atmosphere is so thick and stable that it only has one Hadley cell per hemisphere. Mars' atmosphere, OTOH, is so thin and unevenly heated that it apparently has no stable configuration of Hadley cells.

The outer gas giants of our planetary system also have convective cells in their atmosphere. However, these gas giants lack a significant solid surface and their atmospheres are very opaque. So the pattern of heating and convective "rolls" in their atmospheres are essentially different from those of the terrestrial planets. Our sort of Hadley cells arise from having a mostly solid planet with a thin atmosphere that is mostly heated from below.

Hadley cells in your kitchen. You can form Hadley cells in mildly heated water, if you introduce differential heating; that is, more heating at one end of a pan and less at the other. The exact pattern is a function of liquid density and viscosity. But you should expect rising liquid at the more heated end and falling liquid at the less heated end.

Of course, it's pretty hard to getting the Coriolis rotational effect in your kitchen. But you can get something like it if you use fancy lab equipment.

Rayleigh-Bénard convection. Hadley cells are an example of a well-studied phenomenon in fluid dynamics called Rayleigh-Bénard convection or the Rayleigh-Bénard instability. See here and here for more.

Labels: , , , ,

Wednesday, August 15, 2007

Day, night, and the turn of seasons: Variations

What happens to these daily and annual variations, their symmetries and subtle differences, if the infrared (IR) opacity of the atmosphere is increased?

The key to answering this question is the earlier conclusion about the heightening and reduction of spatial temperature differences: more IR opacity means overall enhanced vertical temperature differences (lapse rate) and diminished horizontal temperature differences. The daily and annual variations are modulated by the basic latitudinal variation of insolation: the equator gets the most, the higher latitudes less, progressively up to the poles. Standing at one point in space on the surface or in the atmosphere, we should expect reduced daily and annual variations. But the effect is not symmetric between day and night, or between summer and winter. Nighttime temperatures are increased, if we compare temperatures from one night to another at the same time and at the same spatial point; wintertime temperatures are increased, if we compare temperatures from one winter to another at the same day of year and at the same spatial point. OTOH, daytime temperatures aren't changed as much, compared from one day to another at the same hour and at the same spatial point; summertime temperatures aren't changed as much either, compared from one summer to another at the same day of year and at the same spatial point.

These comparisons are made across time, without moving in space and being sure to compare like with like: the same hour of the day or the same day of the year. The former comparisons is done between points in space (actually, different latitudes) without regard to time. These properties of climate under increased IR opacity allow us to extend the "differential diagnosis" technique outlined earlier. The earlier conclusions were comparisons in space irrespective of time. Let's now expand the list by systematically examining temperature differences measured over and over at the same point in space.

1. The daily range of temperatures decreases. The daytime temperatures change only a little; the diminution of range is due to increased nighttime temperatures. The day-night gap narrows, even as the overall 24-hour-averaged temperature rises.

2. The seasonal range of temperatures decreases. The summertime temperatures change only a little; the diminution of range is due to increased wintertime temperatures. The summer-winter gap narrows, even as the overall 365-day-averaged temperature rises.

Simultaneously, temperature variation by latitude is diminished. We now have to imagine the whole temperature distribution in space and time - four dimensions!* Fasten your seatbelt.

1. Overall, temperatures go up.

2. The temperature contrast by latitude is weakened.

3. The temperature contrast by altitude is enhanced.

4. The temperature contrast by day and by season is redcued, with the colder hours and seasons experiencing the main increase and the warmest hours and seasons experiencing the least increase. These conclusions merge in the polar regions, where night=winter and day=summer.

All in all, a climate dominated by increasing IR opacity (due to increased atmospheric concentrations of IR-active gases like water vapor and carbon dioxide) has a highly characteristic profile of change. If the Earth's climate exhibited all these changes together over years and decades, then we would know: "global warming" in its popular sense would be happening. If the Earth's climate were moving in the opposite direction, then "global cooling" (reduced IR opacity). If the Earth's climate shows a mixed picture (as it actually is), then IR opacity might be going up - but the climate is dominated by other causal factors, and the "global warming" one (if it is happening at all) is not dominant.
---
* Actually, only three - we're ignoring variation by longitude, since that's (almost) equivalent to variation by hour, as the Earth rotates on its axis.

Labels: , , ,

Monday, August 13, 2007

Day, night, and the turn of seasons: Basics

So far, most of the climate postings here have been about a cartoon of real climate, an "average" world of spring and fall, early morning and early evening. Real climate is not like this; it's a chaotic system always varying, although remaining within a "band." As a rule, averaging climate, especially in space, is not legitimate; it's better to think of this "band" or range as "climate," rather than any average.

Averaging in time is justified, if the average is taken over a fixed time period fundamentally independent of the climate dynamics. Daily and yearly averages, over 24 hours and 365 days, respectively, are the most basic climate averages.* These periods are properties of Earth's orbit and revolution having nothing to do with climate. They do influence climate, of course, but climate doesn't influence them. They're autonomous properties of the Earth that can be taken as independent clocks. Their influence on climate is obvious if you analyze climate variations in time, with the possibility of an infinite spectrum of such periods. The daily and annual cycles are almost always the strongest signals resulting from such an analysis.**

A time average of a function of time f(t) over a period T is: av(f, T) ≡ ∫tt+T dt f(t)/T .

We're all familiar with many of the changes associated with these periods, the cycle of day and night, and the cycle of seasons. The Earth's axis is titled with respect to its orbital plane (by about 23.5o) and the plane of the Sun's motion through the sky (ecliptic). The tilt is fixed with respect to the distant stars, but not with respect to the Sun. As the Earth orbits the Sun over a year, the Sun's daily orbit through the sky changes its angle relative to vertical, depending on latitude. These changes affect the insolation the Earth's atmosphere and surface receive. And the insolation changes over the course of the day, reaching its maximum at local noon and its minimum at local midnight. Because of the lag of hours, these are not the hottest and coolest times of the day. The land, water, and air take time to respond to the inflow of heat. The hottest and coolest times are typically 4 hours after noon and about 4 hours after midnight, respectively. The annual insolation variation reaches its maximum at summer solistice (June 21) and minimum at winter solistice (December 21). The lag of seasons means that the hottest and coldest times of year come about 8 weeks afterwards; mid-August and mid-February, respectively.

While the daily variation of insolation would happen regardless of Earth axis tilt (unless the tilt were 90o), the exact variation by season depends strongly on the tilt. In fact, seasons wouldn't occur at all without tilt, and the tilt creates a connection between geographic latitude and seasonal variation that doesn't exist for daily variation. Not surprisingly, the mildest annual variations are experienced by the tropical latitudes. They get the most insolation over the course of the year. The largest relative variation occurs in the polar regions, and they receive the least insolation over the year. The surface inside the polar circles (the latitudes around the poles within the tilt value of 23.5o) go through 6 months of the year with no sunlight. Within the polar circles, night=winter and day=summer.

Other differences between day and night are coupled to differences between land and sea, or land and air, or sea and air. The switching of convection, temperature inversion, and evaporation between day and night was mentioned earlier. By day, the surface layer of atmosphere over water exhibits a temperature inversion connected to a downward heat flow that supports evaporation; while over land, the air exhibits a steep temperature lapse rate that supports strong upward convection. This difference is the source of cooler daytime air temperatures over water and the formation of summer thunderstorms over land. By night, the situation is reversed. Over water, the temperature inversion switches to a strong lapse rate that supports a strong upward heat convection that cools the ocean off. (Water cools off more slowly than air.) The land experiences a temperature inversion in the surface air layer, as the ground cools off more quickly than does air. Nighttime air temperatures over water are higher than over land. These differences in heat flow and temperature explain the cycle of winds on the coast: landward (ocean breeze) by day, seaward (land breeze) by night.

The next two climate postings will take a closer look at the consequences of these cyclical variations, both in terms of "normal" climate and as focal points for understanding what happens if the atmosphere accumulates more infrared (IR)-active gases (water vapor, carbon dioxide, methane) and acquires a larger IR opacity.

POSTSCRIPT: The peculiar persistence of molecular oxygen (O2) in the atmosphere was mentioned earlier. It seems every number and every molecule gets its own book these days. Thus oxygen gets Nick Lane's fine if curious Oxygen: The Molecule That Made the World.
---
* We could also consider the lunar month (29.54 days) as an another fundamental astronomical cycle. But the Moon's light, reflected from the Sun, is not a significant energy source for the Earth's climate. The Moon does influence the tides of both oceans and atmosphere.

** A branch of mathematical physics called Fourier analysis does just that: break complex motions down into a sum of simple cyclical motions, each with a different period. In general, there are an infinite number of such periods; the relative strength of each period's contribution to the motion is called the Fourier or frequency spectrum of the motion. Future postings will introduce Fourier analysis as a tool for breaking down complex time evolution into simple parts, while also emphasizing the limitations of Fourier analysis if the motion is chaotic.

Labels: , , , ,

Monday, July 30, 2007

Climate on ice

The Earth has been going through a series of Ice Ages in the last few million years. Their discovery and investigation is one of the great stories of modern science. The understanding that human civilization began recently (about 12,000 years ago) during an interglacial (when the ice temporarily retreated) connected the historical and near-historical past with the "deep" human past - before the invention of agriculture and writing - and with our earlier ancestors (genus Homo and genus Australopithecus), whose rise was probably forced by the cooling and drying Ice Age climate.*

Before the Ice Ages started, Earth climate was apparently hotter, more humid, and ice-free - at the upper end of the "Goldilocks regime." Since then, Earth has oscillated between the middle and the cold end of "Goldilocks regime," cooling down and drying out - punctuated by episodes such as our current epoch of middling climate.

Are the Ice Ages understood by modern science? Yes and no. The basic facts of the Ice Ages have been established since the 19th century. Traveling through northern Europe and the northern US and much of Canada, you notice rocky soil, large boulders strewn about, and sharply-etched lakes and rivers - all results of the slowly grinding ice sheets advancing southward and retreating northward. More of the Earth's water volume was tied up in ice during the Ice Ages, and the sea level was lower. There was more coast, and America and Asia were connected by a land link at what is now the Bering Strait. From Siberia, the ancestors of the native Americans crossed the bridge, which was closed off when the last Ice Age ended. The Eskimos (Inuit) continued to cross back and forth by water.

Why the Ice Ages are happening is still not completely clear. Their timing is best explained by the insights of Milankovic first published in the early 20th century. He noticed some striking facts about the shape of the Earth's orbit and the tilt of its axis relative to the plane of its orbit around the Sun. At present, the Earth's orbit is nearly circular, and its tilt from vertical about 23.5o. That tilt defines the relative latitude-dependence of incoming solar radiation (insolation) and the strength of seasonal climate variations. But the tilt is not constant; it's disturbed by the gravity of the Moon and the Sun. The Earth's orbital shape is affected by the gravitational pull of other planets, notably Jupiter, and, if it becomes more elliptical, keeps the Earth slightly farther from the Sun for significant parts of the year. Each of these changes is a complex of oscillations with different periods, notably 41,000 years for the oscillation of the Earth's tilt and about 100,000 years for the Jupiter-induced disturbances. (There is also a weak 26,000-year period from the precession of the equinoxes.) These are exactly the periodicities needed to explain the advance and retreat of the ice sheets. Modern versions of this theory are based on more detailed field work uncovering the history of soil layers and ocean sediments that reveal far more about the ice and its history than was available a century ago to Milankovic. Modern computer calculations of the Earth's orbit and orientation allow more exact reconstructions over long periods.

And modern theories also incorporate a crucial enabling factor missing from Milankovic's proposal, the reduction or cessation of the mighty poleward ocean currents that move excess equatorial heat away from the tropics.** The present positions of the continents (sitting atop the South Pole and nearly landlocking the North Pole) reduce what would otherwise be a stronger poleward oceanic heat flow that would even out the Earth's temperatures more completely. Without these currents, the polar regions would be significantly colder than they already are. In fact, the Earth's climate would be cooler overall, but would also exhibit an even more extreme variation by latitude - another example of an important climate rule of thumb mentioned earlier. The era of ice ages features continental positions and ocean current reductions favorable to polar glaciation. During ice advance, these currents weaken further; during ice retreat, they become stronger. Recent work has led to an expansion of the list of secondary factors to include the effect of cloud and plant variability, in addition to ocean current and insolation changes.

The formation of ice sheets on land is not a simple matter of the polar regions becoming colder. Indeed, colder air has a much lower water saturation vapor pressure and tends to be drier than warmer air. Forming ice on the surface is not the same as the ocean turning into an ice cube. It requires enough warmth to evaporate liquid water, which is then subject to rapid cooling with altitude and latitude, leading to condensation as clouds and then precipitation as snow. And the growth and shrinkage of surface ice sheets formed from snow is not as obvious as it sounds. Cooling air in the polar regions is often correlated with shrinking ice sheets. Colder years still have warm summers, when some of the ice melts. The colder winter air is drier and produces less snow. The net effect, integrated over a year, is glacier shrinkage. Strangely, ice sheet growth is often correlated with somewhat warmer years, for just the opposite reasons. These facts are another reminder that climate is an on-going process, and "things" like ice sheets are really snapshots of processes. Indeed, ice sheets are best viewed, not as signs of cold, but as relics of a rapid and wet cooling episode at some time in the past. They also remind us of the independent importance of water and hydrology, alongside temperature, as a climate variable in its own right.

The modern theory of the Ice Ages (continental positions, poleward ocean currents, Milankovic's astronomical insights) is still not totally satisfactory. But it does fit the evidence well, better than anything else proposed so far, and Milankovic's ideas are as fundamental to modern geoscience as Wegener's theory of continental drift. Unlike continental drift, however, modern science has not directly witnessed episodes of dramatic ice advance and retreat. That leads to some degree of uncertainty.

It also leaves a hole temptingly exploited by the fanatics of "global warming" - proponents of the idea that minor atmospheric gases like carbon dioxide (CO2) and methane (CH4) are a major causative element in climate change. Such an idea collides head-on with the success of this modern picture of the Ice Ages that explains the Quaternary climate pretty well.†

More complete and refined measurements of ice advance and retreat and inferred temperature and atmospheric changes (from gas trapped in ice) provide no support for this obsession either. On the contrary: the temperature changes associated with Ice Age changes consistently precede changes in infrared-active gas concentrations, a fatal blow to the CO2 monomania. The pattern seems to be: temperature change > atmospheric chemistry change > ice change. The missing piece that can't be measured directly is probably the change in ocean currents, although changes in clouds and plants are also possible contributors. All three affect the ice coverage, but they also affect CO2 and CH4 concentrations in the atmosphere. These facts reinforce a conclusion arrived at by other lines of reasoning: these gases are mainly effects, not causes, in the Earth's climate. Changes in their concentration can have a weak, secondary causal effect on climate. The size of the resulting effect is limited to augmentation of temperature swings by no more than about 1 oC for roughly a doubling of the recent CO2 concentration (about 2-3 parts in 10,000). Shamefully, the IPCC's executive summary makes an exaggerated and unsupportable claim of 3 oC for this change, another striking case of bad science based on sloppy reasoning and misuse of evidence.

A simple but complete estimate given earlier was +0.3-0.4 oC for a doubling of CO2 concentration. Loosening the assumptions, but keeping all the crucial pieces of climate (evaporation, water vapor, clouds, convection, etc.), allows a larger estimated range of +0.3-0.8 oC. This estimate might be in serious error. But it is reassuringly both less than the rough upper limit of +1 oC, but not drastically smaller. Violation of the limit would mean the estimate is definitely wrong. Being too small (say, by a factor of 10 or more) would suggest something important missing from the estimate. And keep in mind that this estimate was atmosphere-only; it did not include the mitigating effects of ocean and plant absorption of CO2.

Attempts to invoke minor infrared-active gases as causes of Ice Age changes have flopped. These attempts to rewrite paleoclimate history with minor gases like CO2 and CH4 playing starring roles are reminiscent of the junk science of the "hockey stick." The claims of the "global warming" cult require not only a sense of certainty about climate models and immediate crisis that the science does not warrant; they also require overturning much of what has been learned in the last century and a half about climate and replacing real knowledge with cult "knowledge" - in this case, about the Ice Ages.

POSTSCRIPT: Recent precise measurements of ice core properties: Petit et al. (1999); Fischer et al. (1999); Delmotte et al. (2004).

Recent reviews on the Ice Ages, ice core science, and climate change: Masson-Delmotte et al. (2006); Peacock et al. (2006); Soon (2007).
---
* An interesting, if rather off-beat, version of this theory is the "aquatic ape" theory for the immediate ancestor of Australopithecus, living in a cooling and drying East Africa. The independent science writer Elaine Morgan has popularized and extended this idea. Like the Gaia concept, it has gotten entangled with a certain amount of touchy-feely New Age meshuggas. But the idea has a distinguished pedigree going at least as far back as the early Greek philosopher Anaximander and does explain many odd things about humans.

** The Gulf Stream, running between the Caribbean Sea and the northwest Atlantic, is the best known, but far from the only one.

† The Quaternary Epoch is the age of glaciation-deglaciation and also of hominids, modern humans and their immediate ancestors.

Labels: , , , ,