Thursday, September 04, 2008

"Climate consensus" continues to unravel

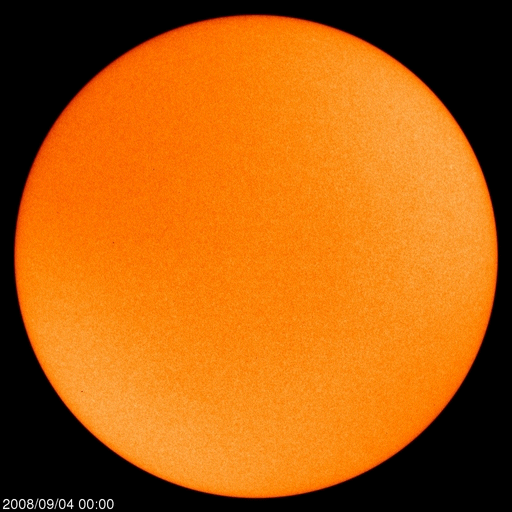
The most curious solar cycle 24 continues its dearth of sunspots. The Sun has now gone more than a month without a spot, the first time in a century (nice roundups here and here).

Why is this important? There is circumstantial but strong evidence that the 11-year solar magnetic cycle and its longer-term modulations are responsible for the Earth's climate variability over decades to centuries to millennia. The stronger that cycle is on the Sun, the warmer it seems to be here; the weaker, the cooler. The best proxy metric for the cycle strength is its exact period, which varies somewhat from just under 10 years to about 11 years. The cycle is stronger when the period is shorter, weaker when longer.

However, other measures of cycle strength are also used. One is total solar surface area covered by spots; another is number of spots. "No spots visible" might mean the new cycle 24 will be weaker. The last four cycles have been fairly strong, with cycle 22 of the late 80s being the strongest of the four. Perhaps not accidentally, temperatures on Earth the last year or so have been ~ 0.6 - 1.0 oC cooler than the decade immediately prior (with annual and daily variations removed).

Meanwhile, some scientific organizations have issued an equally curious call for a lot more money to be spent in climate modeling, because, you see, climate still isn't nailed down. If it means going back to scratch with unanswered basic scientific questions, yes, although I doubt a huge amount will be necessary. If it means continuing down the same deadend path climate modeling has been on for the last 30 years, no, it's a waste. It's more of the same mistakes. But it's not what they said that's really important, it's what's implied: climate is not nailed down scientifically. Indeed.

I think we're within a year or two of laying the manufactured climate crisis to rest for good. Then the science can come out from under its 15-year partial embargo.

POSTSCRIPT: Here's a technical comparison of climate models with observed climate, over weekly-to-century time scales (Koutsoyiannis et al.), with negative conclusions about the reliability of climate models beyond a scale of about a year. That is, conventional climate models are unreliable for "climate" as opposed to "weather." (Hat tip to ClimateAudit.)

Labels: , , , ,

Wednesday, June 11, 2008

Climate reservoirs and budgets

Often we hear phrases like "balance of nature" that imply a natural stasis in the world. It's an old idea, occurring in all human cultures, and running in Western thought back to the ancients and beyond, Plato and Aristotle the most influential. Although the concept of natural stasis has been abandoned by modern science, there is a more limited but precise and up-to-date version of this concept - we've met it before as conservation laws or symmetries.

The role of conservation laws in complex systems is sharply two-faced. On the one hand, what invariant structure they have - what remains over time - is tied directly to these laws. On the other, complex systems typically have such a vast number of variables (degrees of freedom) - think of the weather, or of an ecosystem, or the global economy - that the number of conservation laws is far too few to put much of a constraint on how such system can evolve over time. That is why such systems usually behave in chaotic ways ("chaos is weakly constrained") and exhibit the classic pattern of complexity, the spontaneous formation and dissipation of structures.

Everyday conservation laws. The conservation laws important for the climate (air-ocean system, essentially) are familiar from earlier postings and perhaps from chemistry class. They include conservation of total mass, of individual atoms, of energy. More specialized and qualified forms include conservation of air, water, and heat. For a simple system of a finite number of degrees of freedom, conservation laws take the form

function of variables = constant, or change in conserved function = 0

For a continuous system of flows in space, the conservation law takes the form

flow out of a volume - flow into that volume + change of quantity in volume = 0

For "quantity," substitute mass, number of each atomic element, energy, etc. If you draw the boundaries of the volume the right way, so that there are no flows into or out, the conservation law becomes

change of quantity in the volume = 0

There's nowhere for it to go.

Still useful even if not exact. More generally, "partial" conservation laws are useful for quantities that are not conserved, but can still be tracked by what essentially amounts to an accounting device. For example,

flow out of volume - flow into volume + change of quantity in volume = quantity transformed within volume

For example, chemical or phase changes might make certain quantities exactly conserved (like the number, each, of hydrogen and oxygen atoms and water molecules), while others might be subject to transformations that proceed at a certain rate: for example, particular forms of water - solid, liquid, vapor - which are not separately conserved, but transformed into one another in such a way that the number of H atoms, O atoms, and H2O molecules each remains unchanged.

Symmetry, identity, conservation. And that's why conservation laws are related to symmetries. A symmetry, to a mathematical physicist, says, the system does all sorts of things as it evolves, but certain aspects of it retain a constant identity. The game is then to identify what those "invariant" aspects are. In other cases, certain "almost exact" identities can be picked out and used to make approximations.

Conservation laws and climate. Such conservation laws, in their "spatial flow" forms, are the foundation for understanding climate as an "accounting" system: so much air and water (never leaving or being added to - the climate system is "closed" with respect to air and water), so much heat flowing in and out (the system is "open" with respect to heat flow), so much radiation flowing in and out.

Applying these laws correctly means having to identify "reservoirs" of air, water, radiation, heat, etc., some of them truly closed, if you draw their boundaries correctly; some of them only approximately closed; some of them truly open. It also means identifying flows correctly. For example, "global warming" (enhanced infrared-active gases in the air) changes the flow of heat upward in the atmosphere, but it does not trap heat in a fixed volume in the lower atmosphere. This is perhaps the most exact way to state that fallacy.

Another example is water, both the total amount and flows from one place to another. The amount of water in the air-ocean system is almost conserved; there are some slow geochemical reactions that take water out of the system.* But eventually, that water is recycled, reappears in volcanic eruptions, and gets re-injected into the air-ocean system. That points to another consideration in correct application of conservation laws, that of time scale. Something might be taken out that eventually gets put back in. And the geochemical reactions themselves might be so slow and at such a low level that water in the air-ocean system might as well be considered exactly conserved to high accuracy, over shorter time scales.

A year ago on this blog, conservation law reasoning was used to conclude that an enhanced evaporation rate (from, say, "global warming") would lead, not only to more clear-air water vapor, but necessarily to more condensation, clouds, and precipitation: necessarily, since the water is not escaping into space. So it has to come down, at the same rate it's going up, if we sum over the whole atmosphere.

For truly open systems, on the other hand, it's better to think of the flows as providing a daily or annual "budget" of sorts: so much radiation in per day, so much heat out, and so on. The radiation-heat flow is determined by the Sun's output, which itself is not exactly steady. The climate "works with a budget" that's not exactly the same every day or every year. Another example is water flow, considered not on the scale of the whole planet, but within some limited ecosystem. This system might have water "reservoirs," to use the word in its everyday sense; but these reservoirs are open, not closed, and dependent on direct rainfall and ground flow. Because they're open, such reservoirs will not, in general, be faced with even an approximately steady flow in and flow out. Their "water budgets" vary much more wildly.

POSTSCRIPT: The last solar magnetic activity cycle (the one that peaked in 2001) should have ended last year. Typically, the next couple years see an upswing of activity: sunspots, solar wind "gusts," the new cycle's first solar atmosphere mass ejections. But not this time. The peak should be 2011 or 2012. So far it's unusually quiet.

Such periods of extended or exceptional solar quiescence are almost always associated with somewhat colder temperatures here - which is just what we've been seeing the last year or so. (Hat tip to Instapundit.)
---
* An example is the set of reactions mentioned here last year as removing carbon dioxide from the atmosphere into the oceans. It starts with dissolution of CO2 gas into CO2 bubbles in the water by diffusion, over roughly a 10-year time scale, with an almost equally fast outgassing of CO2 bubbles back into the atmosphere. CO2 molecules are conserved at this step, but not the next. The water (H2O) then reacts with the CO2 to form carbonic acid (H2CO3). A CO2 and a water molecule are destroyed in the creation of one carbonic acid molecule. But the number of C, the number of O, and the number of H are separately conserved.

Then the fun starts. The H2CO3 dissociates in the water, as all acids do, into H+ and HCO3-, then into 2H+ and CO3--. (The + and - are electric charges.) The opposite reactions occur at the same rates, but the CO3-- is also slowly but steadily removed altogether by binding over century or so timescales with ocean salts: potassium (K+), calcium (Ca++), and magnesium (Mg++), all with some positive charge.

The resulting minerals - calcium carbonate (CaCO3, or limestone, chalk, etc.), magnesium carbonate (MgCO3, or dolomite), and potassium carbonate (K2CO3, or potash) - sink to the ocean floor, where, many, many millennia later, they end up contributing to the natural release of CO2 and H2O from volcanoes back into the atmosphere.

Labels: , , , ,

Friday, April 25, 2008

Just passing by

The past year: snow, ice, and cold. Even Baghdad had its first snow in centuries this past winter, something I was unaware of.

Ice ages everywhere. There's some confusion here about "ice ages." The possible solar variability-driven cooling they're talking about is a "mini" or "little" ice age, like the Little Ice Age of 1350-1650 (with lingering aftereffects until the mid-19th century). It means a possible cooling of maybe 1 oC averaged over a year, perhaps a little more. (That's a noticeable change.) A real ice age results from the combination of astronomical changes (in Earth's orbit and spatial orientation) and movements of the continents. The continents are and have been in place for many millions of years; the astronomical conditions come and go. We're not due for it in the near future. Real ice ages mean temperature drops in polar and temperate regions of 5-7 oC up to 10-12 oC. These are much bigger than what's apparently caused by solar variability.

The Sun will have its say. Interestingly, the new NASA solar variability model is predicting a "strong" solar maximum in a couple years. Their new model is another one of those simplified and approximate models used in place of the full theory of solar magnetism, which is far too hard to solve. (Also, no one knows enough about specific conditions in the Sun to even state the full theory properly.) The model is "semi-empirical," which means its uses a mix of some theoretical principles with a lot of analysis of past solar cycles (just like weather prediction on Earth). Its validation is "retrodicting" past solar cycles, but that's not a controlled laboratory test. It's really educated guessing, because it's all we've got. OTOH, the sunspot cycle right now, as observed, seems exceptionally weak, although we've just passed the minimum. In any case, the correlation between Earth temperatures and solar magnetic activity continues to hold up very well, as it has for decades and centuries.

The fading "consensus." The notion that there is a "scientific consensus" on "global warming" - that apocalyptic worldwide warming due to human-emitted infrared-opaque gases is happening, has recently happened, or will soon happen - is a fraud. There's a wide range of opinion on the subject among scientists, shaky (at best) empirical basis for the belief, and scant theoretical basis either, apart from slipshod and mistaken analogies. In climate and closely-related sciences, the "global warming" fanatics are and have always been a small if loud and aggressive minority. Many fencesitters are beginning to grasp the magnitude of the hoax.

These books are more signs that the "consensus" is coming apart:
Contrary to the cult propaganda of Al Gore, these are voices of reason, facing a politically-motivated and imposed pseudoscientific fantasy pushed by vicious environmental activists, demagogic and bullying politicians, and unhinged ex-scientists, then incessantly repeated 24/7 by ignorant journalists.*

(Hat tip to Instapundit.)
---
* You can see examples of the vicious fanaticism of the enviro-wackos on the Web, with reviews that repeat non-facts (formerly known as "lies") about the authors of these books.

Labels: , , , , , ,

Saturday, April 19, 2008

Little darling ...

... it's been long, cold, lonely winter. It has been, the longest, snowiest, and coldest overall and worldwide, in quite a while. And there's still that big Antarctica freeze-down going on Way Down Under.

The UN World Meteorological Organization has belatedly recognized what many meteorologists and ordinary people have been noticing for the last decade: apparently, the globe hasn't warmed since 1998. The trend has been a little more complex, I think: probably cooling slowly from the mid-90s to around 2003, then sharper cooling since then - all interrupted by a couple hotter, drier years 2000 and 2001, suspiciously around solar magnetic maximum. (The same happened in 1988-89, at the previous maximum.) Readers of this blog will not be surprised, either about the longer cooling trend or the short warming spells around solar magnetic maxima. The post-1998 seems to be connected to a re-sync-ing of the Earth's internal climate cycles, signaled most forcefully by changes in El Niño/Southern Pacific Oscillation (ENSO). Something similar going the other direction happened in 1977, apparently leading to a nearly two-decade warming spell.

I'll leave aside that little technicality about spatial averages of local thermodynamic variables like temperature being meaningless. A statistical proxy index doesn't have to be the temperature of anything (and it isn't) to still indicate a trend. What the trend means, is far less obvious than many people (including the IPCC) think.

Naturally, this frustrates my plan to write my mature masterwork, an Italian opera called Si Ricalda Il Globo. It's supposed to feature, as protagonist, the frustrated crown prince Alberto, so rudely pushed aside by the nouveau riche and less polished Arbusti clan from Texas. His scientific antagonist is Il Dottore Termale, played by a certain Christoforo, who enters with his dramatic baritone aria, "Non si fà la media delle temperature." Alberto also sings baritone, but more screechy. They're rumored to be twins separated at birth.

I guess I'll have to wait til the next warming spell.

POSTSCRIPT: Is Ted Turner senile? I guess only Jane Fonda knows for sure. Recently on the Charlie Rose show, he raved on about yestercentury's "crisis" of overpopulation and how we're all going to be eating other in a fit of cannibalism as it gets warmer and warmer. Nothing like crabby left-wing billionaires bloviating about a world they don't understand.

If it is cannibalism, let's eat the Left first and agree now to play my opera as background.

POST-POSTSCRIPT: But no cannibalism on Passover - chag sameach!

Labels: , , , , , , ,

Wednesday, April 16, 2008

Cycles of climate: The Sun

Most stars are variable. Their large variability in total luminosity (watts of output, summed over all wavelengths of electromagnetic radiation) is often due to internal heat cycles, similar to the Earth's internal climate cycles, but on a far grander scale. (Stars are thousands of times bigger than the Earth.) Another, less dramatic but still important, form of variability is due to stellar magnetic fields and magnetic cycles. The Sun is a variable star of this magnetic type. Right now, it is unusually stable compared to similar stars with similar magnetism. But that was probably different in the not-too-distant past - and almost certainly will be different in the not-too-distant future. It's essential to realize that the Earth's climate is not a closed system, but mingles high above our heads with various emissions (electromagnetic radiation, magnetic fields, and charged plamsa) from Sun.

Time scales of climate change. The climate cycles in a previous posting were multiannual and multidecadal, observed by modern scientists with modern instruments. But the paleoclimate record, embodied in proxies such as sea corals, tree rings, gas bubbles trapped in bogs and ice, and much more along the same lines, shows clear signs of longer-term cycles. Historical records made before the arrival of modern scientific instruments in the 19th century are also of value here. A thousand years ago, grapes grew in Britain and southern Greenland was pretty hospitable - it wasn't all just Viking propaganda :)

If we zoom out to the time before the rise of civilization or modern humans, we come to the time scale of the Ice Ages, running from tens of thousands to tens of millions of years. Previous postings (here and here) already discussed the Ice Ages and how they're controlled by a combination of astronomical cycles and movements of the continents. The astronomical part controls the timing of the Ice Ages; and the continental positions and the related poleward ocean currents, their intensity. Infrared-active gases like carbon dioxide and methane are minor to unimportant.

Between the one-to-10-year and the 10,000-to-10-million-year range, we have three "log decades" or "powers of ten" (101 to 104 years). There are probably subharmonics of the internal Earth climate cycles lurking here, with lower frequencies and longer periods.

The central importance of the Sun. But when you think "global climate," the first thing that ought to come to mind is the Sun, not something humans are doing. The Sun is the one major influence that affects all of climate everywhere simultaneously. The paleoclimate proxy evidence on this score is very strong.

The mother of all ups-and-downs on centennial and millennial time scales is solar magnetism. This related bundle of cycles has so many impacts on the solar system and the Earth, it would take a whole book to spell them all out, and just at a fairly non-technical level. Here's a whirlwind tour in one large posting.

Solar magnetism: Its effects on the Earth.
The Sun's magnetism varies on a roughly 22-year complete cycle, with shorter-term irregular "flickerings" and longer-term, low-frequency subharmonics. The most dramatic effects people see on Earth are a result of the "space weather" that solar magnetism stirs up. At solar magnetic maxima, intense solar storms slam large ejections of rarefied, magnetized hot plasma into the Earth's own magnetic field, setting off upper-atmosphere auroras in polar regions and messing with electrical and electronic equipment worldwide. Astronauts have to go back inside or just come home, to protect themselves from the intense flux of solar plasma. Anything depending on terrestrial magnetism can be knocked a-kilter: humans (if we use a compass), and birds and dolphins (they have small magnets in their brains for navigation).

The last solar maximum occurred in 2000; the one before, in 1989. You can learn more about space weather here.

Solar magnetism: Its origin and nature. Most stars have significant magnetic fields that arise from the circulation of charged particles in their rotating hot plasmas. (The Sun rotates about once in 26 days.) For reasons still not completely clear, the Sun's magnetism, which is roughly laid out like a bar magnet (north and south poles), switches magnetic polarity roughly every 9.5-11 years and completes a cycle every 19-22 years. The hot solar plasma interacts with this magnetic field near the surface, becoming entrained in the magnetic field lines. In the outermost (transparent) solar atmosphere, the plasma pressure is not fully balanced against gravity, and a hot, thin plasma solar wind blows outward, taking magnetic field lines with it. Its speed and particle flux are 400 to 750 kilometers per second and about 100 billion particles (charged ions) per second per squared centimeter. The density is typically 5-10 particles per cubic centimeter, although in a massive eruption, the density and flux can be 10 times their "normal" values. This is pretty rarefied compared to our environment, but still far from a true vacuum.
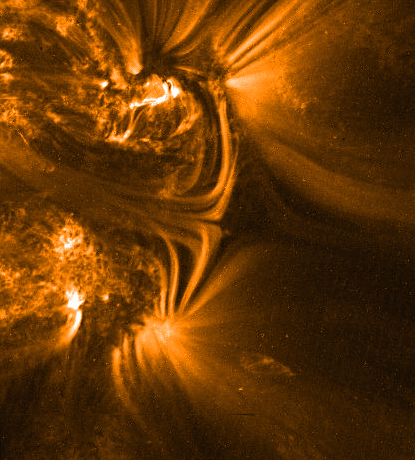
The Earth's own magnetic field (magnetosphere) generally protects us from the solar wind - but not entirely. When the Sun switches magnetic polarity, the solar wind is interrupted repeatedly by massive ejections of hot, magnetized plasma. These mainly occur near the solar rotational equator, which is close to the Earth's orbital plane. The Earth is subject to some of these magnetic plasma ejections. During this phase of the cycle, the strength of the Sun's magnetic field near the surface reaches a maximum.

Solar magnetism: More stuff happens. The most visible result of this intensified solar magnetism near the surface is sunspots. Other stars, rotating and magnetized, have them as well, and also exhibit a periodic rise and fall in their magnetism and starspots. Sunspots are places where the field near the surface pokes out, forming partial field loops that connect paired spots (one N, the other S, polarity).

The best proxy for solar magnetic intensity, it turns out, is not the number of sunspots, but a combination of the total area the spots cover and the magnetic cycle period length. Strangely, while the centers of the spots are indeed darker than the surrounding solar surface, the areas near the spots (the faculae) are actually brighter. The net result is that, for our Sun, solar magnetic maximum is also a solar brightness maximum; solar magnetic minimum, a brightness minimum. Comparing one cycle to another, a solar maximum is stronger if the associated cycle is shorter; weaker if longer.*

Solar brightness, total and differential. The Earth's upper atmosphere. The solar brightness has varied by somewhat less than two-tenths of percent over recent solar cycles. Using a rule from radiation thermodynamics, the surface temperature of the Earth should, naively speaking and ignoring any complicating mechanisms, vary as ΔT/T = ΔB/(4B). So a few tenths of a percent in solar brightness B (ΔB/B ~ 0.002) might give rise to about a tenth of a percent variation in the Earth's surface temperature. For T(E) = 288 oK, that's ΔT(E) ~ 0.15 oK, small but not negligible. It's a factor of a few off from predictions of semi-realistic "global warming" scenarios that include the effect of enhanced clouds and convection. And indeed, Fourier-analyzing temperature variability does result in a harmonic spectrum that includes, among other features, a suspicious peaks near 1/11 inverse years of frequency. Years with solar maxima do tend to be hot and dry.

And Nature has a further trick up her sleeve. While the solar total luminosity doesn't vary much, the ultraviolet (UV) part of the spectrum varies disproportionately over the solar cycle, by 10% or more, with "strong" solar maxima showing larger increases in solar UV. Its presence or absence over the daily cycle expands or shrinks the Earth's upper atmosphere and changes the ozone-rich boundary between the upper and lower atmospheres. This daily effect has been measured for over a century by its impact on surface air pressure. (See this old posting.) Without a fairly exact understanding of vertical heat transport in the Earth's atmosphere, it's hard to infer from this daily pressure variation the corresponding variation in the atmosphere's temperature distribution. Naively, it should be roughly 0.4 oK, and there are good reasons to think (see below) that the variation is enhanced by a factor of two to three.

What this means for the 11-year solar cycle is currently the subject of intense debate and investigation. Comparing our star to others similar to it, it's not unreasonable to think that it can exhibit (over centuries and millennia) larger brightness variations than seen in the last 30 years of satellite measurements. Combined with enhancement within the atmosphere (especially from the lowering and raising of the ozone "lid" on the lower atmosphere), there's a clear implication that even small variations in solar brightness can have noticeable effects on the Earth's surface.

The solar wind and cosmic rays: Maybe it does something to the clouds. An idea more difficult to evaluate is rooted in another side-effect of the solar wind. The wind strengthens during solar maximum and weakens at solar minimum. Outside the Sun's magnetic sphere of influence (the heliosphere), which extends out to roughly 90 Earth orbital radii (8 billion miles or so from the Sun), is the interstellar medium and a very rarefied flux of extremely energetic charged particles called cosmic rays. (More rarefied than the solar wind itself: the cosmic rays are one particle per cubic centimeter). They're mainly protons (hydrogen nuclei). The solar wind keeps many of them out of the inner solar system, but not all.**

Most of Earth's clouds form, not by spontaneous condensation of pure water droplets (which is a pretty slow process), but by nucleation, water droplets glomming on to other particles floating in the atmosphere, mainly dust and aerosols. This catalyzed or induced condensation is much easier than for pure water droplets and the main reason we have clouds.

What does that have to do with cosmic rays? When they hit the Earth's upper atmosphere heading toward the surface, they leave behind a trail of ionization, temporarily charged atoms - air molecules that are temporarily stripped of some electrons. Such trails are perfect nucleation sites for water droplets or crystals to form.

When the solar wind is weaker, more cosmic rays get through and (maybe!) induce more water condensation in Earth's atmosphere: more clouds, less sunlight, lower surface temperatures. When the solar wind is stronger, the opposite might happen.

The ups and downs of the flux of cosmic rays hitting the Earth's atmosphere is established, for the era prior to scientific instruments, with the formation and deposition of beryllium-10 and carbon-14 in ice and organic material. These radioactive variants (isotopes) of the standard elements (beryllium-9 and carbon-12) are tracers of the strength of the cosmic rays that produced them.

The Sun's variability affects the Earth's climate. We can summarize all of these effects in a little table.
Sol         Sunspots    Solar brightness    Cosmic rays    Clouds        T(E)
magnetism (total area) (total and UV) at Earth
-------------------------------------------------------------------------------
Up Up Up Down Down (?) Up
Down Down Down Up Up (?) Down
The evidence for significant solar modulation of Earth's climate is indirect but compelling. Every index of climate (temperature, pressure, clouds, and rainfall) shows a component in its variability with the solar magnetic cycle period (9.5-11 years). When we consider the more irregular flickerings of solar brightness over shorter time scales (months to a few years), the connection can be brought down to the level of specific events and timings. Statistical tests of significance consistently yield correlated variability between solar and climate variation at 50-80%.†
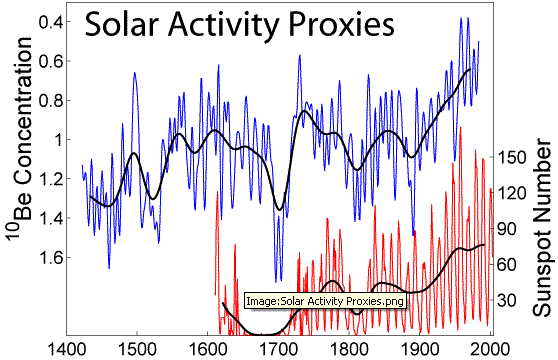
And there's compelling history too. Paleoclimate records exhibit a tight connection between cosmic rays and climate proxies. The solar magnetic cycle is itself modulated over much longer times by irregular waves of weaker and stronger solar maxima. The Sun was exceptionally active during the Medieval Warm Period (c. 800-1300) and exceptionally weak during the Little Ice Age (c. 1300-1650), with reported sunspots and reconstructed cosmic ray fluxes correlated in just the way expected from the little table above.††

And where's "consensus" science? You might think this would be an area of active research, with lots of scientists swarming all over it. There has been a lot of work on the Sun-Earth connection since it was first suspected in the 19th century. Interest faded in the 20th century, at least until the 1970s, with the arrival of satellites and the first successful paleoclimate reconstructions.

But there's not enough research in this area. From the point of view of how the sciences are presently divided up, it's highly interdisciplinary and causes suspicion because it crosses so many academic boundaries. And in the last 20 years, of course, we can't escape the bad effect the "global warming" hysteria has had in discouraging scientists and redirecting research funding away from such work. Citing early, limited, and poorly executed statistical studies, the IPCC has repeatedly dismissed the connection, for no good scientific reason. The scientific annexes of the IPCC reports do mention the connection and regard it as important, "poorly understood," and deserving of more research. But that sound scientific advice has been ignored: it's not "with the program."

See here, here, and here for some recent developments in the saga of solar variability affecting - not the Earth - but Mars and Neptune. No industrialization out there: another demonstration of how little we understand climate.

References

Caution with some of the amateur Web sites out there on this topic. Opposing the fake "consensus" theory of "global warming" due to (the misnamed) "greenhouse" gases, their heart is often in the right place. But they're often sloppy with their science. Much more reliable are the three climate blogs linked at right in the blog roll.

= D. V. Hoyt and K. H. Schatten, The Role of the Sun in Climate Change, Oxford U. Press, 1997.

= B. Fagan, The Little Ice Age, Basic Books, 2001.

= W. W.-H. Soon and S. Yaskell, The Maunder Minimum, World Scientific, 2004.

= S. Baliunas, in Shattered Consensus, P. J. Michaels, ed., Rowman & Littlefield/George C. Marshall Institute, 2005. Short, semi-technical survey of current knowledge. Stresses both the evident empirical reality of solar modulation of climate and our poor theoretical understanding of it. The scientific annexes of the IPCC reports are not that different in spirit.

= S. F. Singer and D. Avery, Unstoppable Global Warming, Rowman and Littlefield, 2006. Identifies the MWP and LIA as part of a long-period (1500-year) modulation of the solar cycle attested by hundreds of thousands of years of climate proxies in ice core samples.

= Streaming video of a talk on solar physics basics by astrophysicist Kelly Korreck at the Harvard-Smithsonian Center for Astrophysics, February 2008 (see this page).

---
* It can be, and is, different with other stars. In some stars, more spots lower the brightness, overall. Their magnetic cycle periods are also not rigidly constant, but vary within a range, from one cycle to the next.

Sun-like stars with similar magnetism typically show brightness variations larger than currently seen on the Sun, a few tenths of a percent, up to about a percent.

** To clear up a frequent confusion: scientists today refer to these galactic cosmic rays as "the" cosmic rays. They have individual particle energies in the 100s of millions of electron volts (100s MeV) to a few billion electron volts (GeV). They probably originate from our Galaxy's cumulative history of supernova explosions.

In older publications, the solar wind particle flux was sometimes referred to as "cosmic rays" as well. These particles have much lower (although still pretty large) energies, roughly 10 to 1000 electron volts (10 eV to 1 keV). These are typical of the energetic X-ray emissions from atoms, and the particles are accelerated by mechanisms that transfer comparable energies. A typical atomic transformation in everyday chemical reactions is one to 10 electron volts (1 to 10 eV), by comparison, up to a thousand times smaller than the solar particles and a million to a billion times smaller than the galactic particles.

† That is, both phase and frequency information are available and are closely correlated, not just frequency information. See Scafetta and West (PDF). Wavelets (a mix of time- and frequency-domain analysis) are a better way to analyze this than pure Fourier analysis. Typically significance is tested with nonparametric methods like principal component analysis.

†† Very large sunspots were noted on the Sun's surface at that time by Chinese astronomers who, unlike their European counterparts, were not prejudiced into thinking that a heavenly body has to be "perfect." Without telescopes, they observed the sunspots at sunrise through thin clouds. Earlier naked-eye sitings date back to antiquity.

The rise of telescopic astronomy in western Europe in the 1600s marked the beginning of more controlled observation of the Sun. But as luck would have it, that happened in the later part of the Maunder Minimum, a dearth of sunspots - and very cold Earth temperatures (Little Ice Age). Over the last 450 years, the Earth has been recovering from the LIA, although the recovery has been interrupted by several, less severe, sunspot minima.

Ironically, there has been some resistance among climatologists to accepting the fact that the Sun is a variable star. The Sun's input of electromagnetic radiation to the Earth's climate is sometimes called the "solar constant" (about 1370 watts per square meter). Discovering that the "solar constant" isn't really constant was like discovering in the 1600s that the Sun isn't an unblemished celestial orb.

Such language confusion, like the use of climate "anomaly" and "forcing" - which have precise technical meanings and don't necessarily mean something bad is happening - is one cause of climate hysteria. Platonism has been dying a long time in the sciences of the West, and it's sustained by both popular and elite misunderstandings of this type.

Labels: , , , , , , , , ,

Monday, March 24, 2008

Climate science the right way: An example of the Sun-climate connection

Many people have noted and investigated the connection between the Sun and the Earth's climate. Since the late 19th century, most of the scrutiny has focused on the Sun's roughly 11-year magnetic cycle.* Its connection to the Earth's climate is small but significant, important enough to be one of the prime determinants of Earth climate during the current interglacial period. We'll return to this solar influence later, as it's not fully understood.

But there is another influence. The Sun "flickers," over its whole radiation frequency range, on time scales running from days up to a few years. (The technical name is total solar irradiance (TSI) fluctuations.) This flickering leaves an "imprint" on the Earth's climate which will show up in many measured time-series indexes. Because the Earth's climate is nonlinear, we should expect subharmonics to form, at lower frequencies or longer periods - months to decades. The IPCC and many scientists tend to dismiss such intermittency as noise - as if chaos had never been discovered and thrown into question whether "noise" even exists at all.

A newly published empirical study of the Sun-Earth climate connection demonstrates that indeed this does happen. Not only does it happen, this flickering alone explains roughly half of the variation of a "global temperature" statistical index over the last 60 years.** The authors, Scafetta and West, summarize their work here (PDF). They extended it back over the last four centuries by combining the shorter-term flickering with the 11-year solar magnetic cycle variations and explained roughly three-quarters of the variations of the "global temperature" index.

Scafetta and West's work is a beautiful piece of science done right. They identified the correlation between the flickering signal and the temperature index signal in an airtight way, checking their result by randomly scrambling the data's time ordering to see if their result would change. It didn't. As they point out, this result indicates that, while the coupling between the "space weather" caused by solar changes and the Earth weather is weak from the point of view of energy transferred, it does conserve information: the same structure of events and times in one signal shows up in the other, like a faint echo mimicking some distinctive signal.

"Consensus" science fails again. So what gives in the world of "official" climate science? While the scientific reports of the IPCC do acknowledge that the Sun-climate connection is important, they waffle on its exact nature and significance. The IPCC summary reports arrogantly dismiss it altogether. Previous attempts to nail it down quantitatively came up with ambiguous results. But Scafetta and West's methods show why: those negative results came from statistical techniques based on Gaussian "Mediocristan" methods and assume the central limit theorem. We've seen how it can and does break down; chaos and Extremistan behavior is all around us. It's taken science and mathematics several centuries to be able to cope with such phenomena, but modern methods up to the task are available.†

Why aren't they being used by the IPCC? Beats me. But one obvious result of the politically-driven, journalistically-obsessive climate hysteria is junk results based on unphysical concepts and bad methods - methods and concepts that have been proven wrong, don't make sense, or have been superseded. This cost of climate hysteria - the cost of bad theory, scientific regression, and intellectual corruption - is a serious topic for another day, one that deserves its own consideration.

My only real beef with Scafetta and West's summary of their technical results is that Physics Today published it as "opinion." It's not: it's real science. What can be said about the IPCC and its executive summaries is another matter.


In a short while, we'll see other, similar, but older results that seem to get up to 80% or so of the temperature index variation by comparing it to the Sun's variability. I'm willing to bet money on the proposition that, with all these solar influences taken into account and combined with the Earth's internal climate cycles, all or almost all (90% or more) of the variability can be correlated, not just back four centuries, but all the way back to the end of the last Ice Age.††

POSTSCRIPT: Here's another nail in the "global warming" coffin, from NPR: the case of the missing ocean heat that "should" be there. (Hat tip to Instapundit.)

As the coffin nails pile up in the case of "global warming," some are even talking about the pending collapse of the whole climate scare: see this from The Australian.
---
* Now you know enough to understand that "roughly periodic" means its Fourier spectrum isn't peaked at one frequency, but has a well-defined, but not infinitely narrow, peak at around 1/11 inverse years of frequency. The "flickering" is a broader, flatter part of the spectrum at higher frequencies running from inverse months to inverse days.

The solar irradiance is itself modulated by strongly non-linear processes near the Sun's surface, including the Sun's magnetism. Some of these processes themselves seem to be chaotic. So we have one chaotic system (the Sun's surface and atmosphere) coupled to another (the Earth's climate), the former "pumping" the latter with energy and leaving behind distinctive "information fingerprints."

** Such an average is physically meaningless in and of itself. But all points on the Earth's surface illuminated by the Sun experience this flickering, and the effect under discussion here necessarily has to show up in some way in any statistical index built up from local temperature measurements. The index used doesn't have to have a physical meaning.

† Scafetta and West state their result in terms of the statistical distribution P(t) of the time t between "events" (flickerings), which is different from, but equivalent to, the chaos and non-Gaussian discussions earlier. They find P(t) ~ (λ/t)α, with α about 2.1 to 2.2.

In the Gaussian case - which would hold if, for example, the Earth were a closed thermodynamic system at a single temperature - this distribution would be exponential, P(t) ~ exp(-t/λ), with some relaxation time λ characteristic of the whole system. This is roughly the time that it takes a system to "settle down" after a single external disturbance.

Power-law, instead of exponential, decay in time of a disturbance is a different sort of "long tail" phenomenon. It means the disturbance takes much longer to really disappear than you might naively expect. Such behavior has been seen in laboratory measurements of controlled systems since the 1930s. Recall that a chaotic system is one that never settles down. The disturbances never stop; one leads to another, and so on.

†† I'm excluding the exactly periodic daily and annual cycles. It's sometimes good to state the obvious.

Labels: , , , , , , ,