Wednesday, April 09, 2008

Chaos and markets II

For those who teach finance, a number seems better than no number — even if it’s wrong.

- Mandelbrot and Taleb

It's the Tyranny of the Cookbook, to which we can reply: No number is better than some number - especially when it's wrong.

Much financial advice is common-sensical, but in recent decades has incorporated misguided notions of implicitly Gaussian or bell-curve statistics in analysis of price movements, as well as false concepts of "efficient markets." You often hear the jargon of means, variances, and betas. (A beta is just price volatility defined as a second moment, or a variance. The square root of the variance is the standard deviation.) We've already seen a truckload of examples of where and why such concepts break down and why methods based on such assumptions are wrong. The fact that this approach to finance has a Nobel prize is irrelevant.* The methods and concepts have spread from academic finance and economics departments to the desktops and minds of investment specialists in the last 30 years and done significant damage: the Long Term Capital Management crisis in 1998 and the mortgage crisis of 2007-08 were both made possible, in part, by such "professional consensus" malpractice. Here we have legendary cases of Platonified false expertise and the "empty suit" syndrome. The price change distributions are fractal-driven power laws, not bell curves, a fact first presented to the economics world almost 50 years ago by Mandelbrot - and then rejected because it didn't fit convenient, if unempirical, Mediocristan assumptions. The missing practical key is the widely unrecognized enhanced risk of large fluctuations, especially downward moves. Individuals and institutions adopting wrong rules expose themselves unwittingly to much larger risks than they realize.

If we drop the assumptions of bell-curve price fluctuations and efficient markets, where do we stand?

The first is basic math and science: get your units straight. People who practice finance usually get this right, but it's amazing to see ignorance even in the business pages about this. Economics, like mechanics, has three basic types of units: money (a universal store of value and medium of exchange), things or activities (count them distinctly and don't commit the Fallacy of Aggregation, lumping bananas and pork bellies, say), and time. The essential point is that wealth is an accumulation of flows. The flows are prices (measured in money) times things or activities (quantified somehow) divided by increments of time. Interest rates are prices divided by prices divided by time, or just 1/time. Wages are money per unit of labor (an activity) per time. And so on.

The principle of diversification remains, but its rationale changes. It's not "everything will even out" (it doesn't always), but "we don't know very well how individual investments and investment classes will perform - sample all of them." Diversification, not only within investment classes, but especially across classes, is even more important in Extremistan than in Mediocristan.

More basic to the uncorrelated, Gaussian price movement picture is the efficient market hypothesis, which has failed in a number of crucial respects. Market timing matters, especially if you're making large moves (investing or liquidating). The market analysis based on this wisdom is called "technical analysis" or "charting," and its advocates are called "chartists." They stare at price chart patterns. In the "uncorrelated random walk" picture, these patterns mean nothing. But in fact they do mean something. Market moves are indeed correlated across time. Only after three to five years do they start to lose their memory, and it's not clear that they ever entirely do.

Furthermore, there are investment classes that consistently under- and overperform the whole market average. The best-known underperformer is the class of "growth stocks," because they're hyped by the media and analysts to the point where buyers demand them strongly - they're consistently overpriced relative to their long-term performance. OTOH, there are underpriced investments: so-called "value" stocks, for example. Warren Buffet and others have made a fortune hunting for undervalued but worthy investments. It's all boils down to not paying more for an investment than it's worth.

Finally, the "fat tail" phenomenon should make everyone suspicious of probability distribution moments (means and variances). If misanalyzed using Gaussian assumptions, fat-tailed distributions appear to be non-stationary: if you keep sampling such distributions to estimate moments, your results will not, in general, converge as you add more data points. The estimated moments will just keep growing. After an infinite amount of sampling, they diverge to infinity. While means and variances are measures of performance, they're not good measures.

The devil's staircase. A better approach than looking at daily movements is to look at cumulants (integrals) and at absolute linear ranges (price highs - price lows). The cumulant is more stable than the daily changes in value, and sudden jumps in the total value of an asset or flow of goods and services show up clearly. (The fact that such sudden jumps often dominate the total or cumulative history of an asset or market also stands out clearly.) The absolute linear range grows with time, but gives you some sense of the best and worst the market can do. These are the rules of the road in Extremistan. "Mild" variables change by a large number of small increments. "Wild" variables change by a small number of large increments, and "really wild" variables change mainly by a handful of very large increments.

Markets with an incomplete cookbook. The investment community at large still has not fully absorbed Mandelbrot's message about fractals and the uselessness of Gaussian, bell-curve statistics in understanding and prospering in markets. The normal and the Levy-type distributions look similar when you compare them for small deviations from the mean.** It's the large deviations that constitute the acid test, and it is here where investment professionals often start waving their hands.† In a Gaussian world, such large changes shouldn't occur almost ever, and the history of Gaussian markets would be dominated by many, many small changes. But real markets are strongly shaped by a limited set of rare, large, and consequential events. A new investment science to replace the rigorous, Platonified irrelevancies of contemporary financial theory is badly needed.

POSTSCRIPT: Here's a short note on market risk by Mandelbrot and Taleb from a few years ago.

References

= B. Malkiel, A Random Walk Down Wall Street, rev. ed. Classic presentation of efficient-market, Gaussian random walk theory to the masses. Much of the technical side is wrong as a picture of markets, but the basic investment advice (the trade-off between active and passive investment, diversification) is sound.

This posting is a sketch of what's needed to replace the bell-curve price movement framework. Just noted today: the embarrassing underperformance of stock index funds since the 2000 market peak, compared with even lowly bonds, not to speak of value stocks.

= R. Haugen, The Inefficient Stock Market. Nice short, if technical, study of systematic inefficiencies (over- and underpricings) in markets.
---
* Black and Scholes won it in 1997, and Taleb and others have railed against this as a perfect example of rewarding Platonified bullshit with its origins in academic circles, with highly restrictive assumptions, applied to real life where those assumptions don't hold. The LTCM crises occurred less than a year after the award - again suggesting a just G-d, or perhaps one with a refined sense of humor.

A larger objection can be made against the economics Nobel prize altogether, and Taleb and others argue that as well. It's actually a Nobel foundation prize paid for by the Royal Bank of Sweden, not specified in Nobel's will. Although some great and deserving economists have won it (Hayek and Friedman among them), in general, it's difficult to argue with the reality that economics has often been subject to both fads and conveniently cookbook pseudoknowledge. The standards for the Nobel prizes in the natural sciences are much stricter, and I hope they remain thus, so that at least those Nobel prizes mean something.

** Actually, the log-normal. The Gaussian bell-curve is applied, not to prices, but to the logarithms of prices. Small changes in prices are then translated into small percentage changes. (For price P, the differential dP is replaced by dP/P.) For small ΔP's, the log-normal and Lévy-type distributions look almost identical - it is here that the theorists of the Gaussian random walk go astray.

The "random walk" idea can be taken beyond the Gaussian or normal type and recast into a more general form of Lévy flights, dropping the requirement of finite distribution moments. To handle correlations over time between events, it can also be generalized in another way, to have memory: fractal random walks. Such erratic "random" or "drunkard's walks" are an important tool for applying statistical methods to dynamics under conditions of limited knowledge. The random walk is also central to analyzing diffusion (both standard Gaussian and "anomalous" fractal types). In chemistry and biology, the random walk is sometimes called Brownian motion.

† In the last generation, improvisations have grown up around the failure of Gaussian methods, but this series of ad hoc patches and fixes doesn't get to the root of the problem. Some analysts still just take out large deviations ("outliers") by hand, a kind of data denial. Others appeal to the notion of "exogenous" (outside-the-system) shocks, which destroys the method's predictive (if not its retrospective) powers.

The most sophisticated patch is to make the Gaussian parameters depend on time, the common version being GARCH. This is the best you can do within the misguided Gaussian framework; in that wrong framework, the actual (and probably stationary) distribution of price movements looks non-stationary. The time-dependent parameters are supposed to mimic this, but at the cost of largely destroying the method's predictive power.

Labels: , , , , ,

Tuesday, April 08, 2008

Chaos and markets I

Chaos as an idea and metaphor applies not only to the natural sciences, but the study of human society as well. It's always important to clearly distinguish between metaphors, and models and analogies. The former are loose and poetic, and treacherous if you try to extract precise conclusions from them. The latter are misleadingly precise and suffer from the illusion that everything about chaos can be reduced to cookbook. Fuzzy is comprehensive but imprecise; precise only seems under control, because the untamable part of chaos gets excluded before you even start. When facing chaos, it's better to be approximately right than precisely wrong. So caveat emptor.

Financial and other economic markets are prime examples of chaotic behavior in human life. They feature individual agents acting rationally, but with limited information and often conflicting goals. The torrent of financial information available gives many people the illusion that, somewhere, someone knows what's going on.* Actually, the people in charge of large institutions and the power to set rules of the game are often some of the more poorly-informed actors, precisely because the scope of their responsibility is so broad and the impact of their decisions so difficult to fathom ahead of time.

There are experiments in behavioral economics that do yield important and controlled information about human economic reasoning and decision-making. But the whole subject, while fascinating and full of insights about the limitations of "economic rationality," is in its infancy. Hopefully, in coming years, the results of behavioral economics will come to displace the "likely-story" Platonified and often false mathematical models that have ruled in economics and finance since the 1960s.**

Economies and cycles. Economic evolution does show some characteristics of irregular waves and more regular cycles. The best known is the six-to-ten-year business cycle, which is an investment-driven cycle in which consumption of what is produced is the final step closing the loop. Recessions occur at the end of these cycles, when investment and consumption across the whole economy tend to get weak all at once. There are shorter-term cycles, of roughly two to four years in length, which are inventory or "reservoir" cycles associated with economic demand rising and falling in various sectors (like housing, in the current bust). They're waves of building up and depletion of inventories. These waves of bubble and bust can be amplified by bad government policy (again, as we're seeing now).

Longer, irregular waves of economic activity are harder to pin down, but well-attested in the historical record. The best-known, if still controversial, is the Kondratieff wave, of approximately 50 to 70 years in length. It's the "two-generation" economic wave.

Cycles! None of these phenomena is simply periodic, but irregular - multiperiodic, shot through with some chaos.

Economics and statistics: Normal, log-normal, and power laws. If we forget about specific events, specific times, and specific histories, we fall back on a statistical description of economic change. Individual events get binned by type, character, and frequency. When we look at economic change as fluctuations of prices and flows of goods, we see the effect of both "normal" and "fat tail" processes everywhere. These form an object lesson in the power of "black swans" and the larger crowd of "grey swans" to shape economic history.

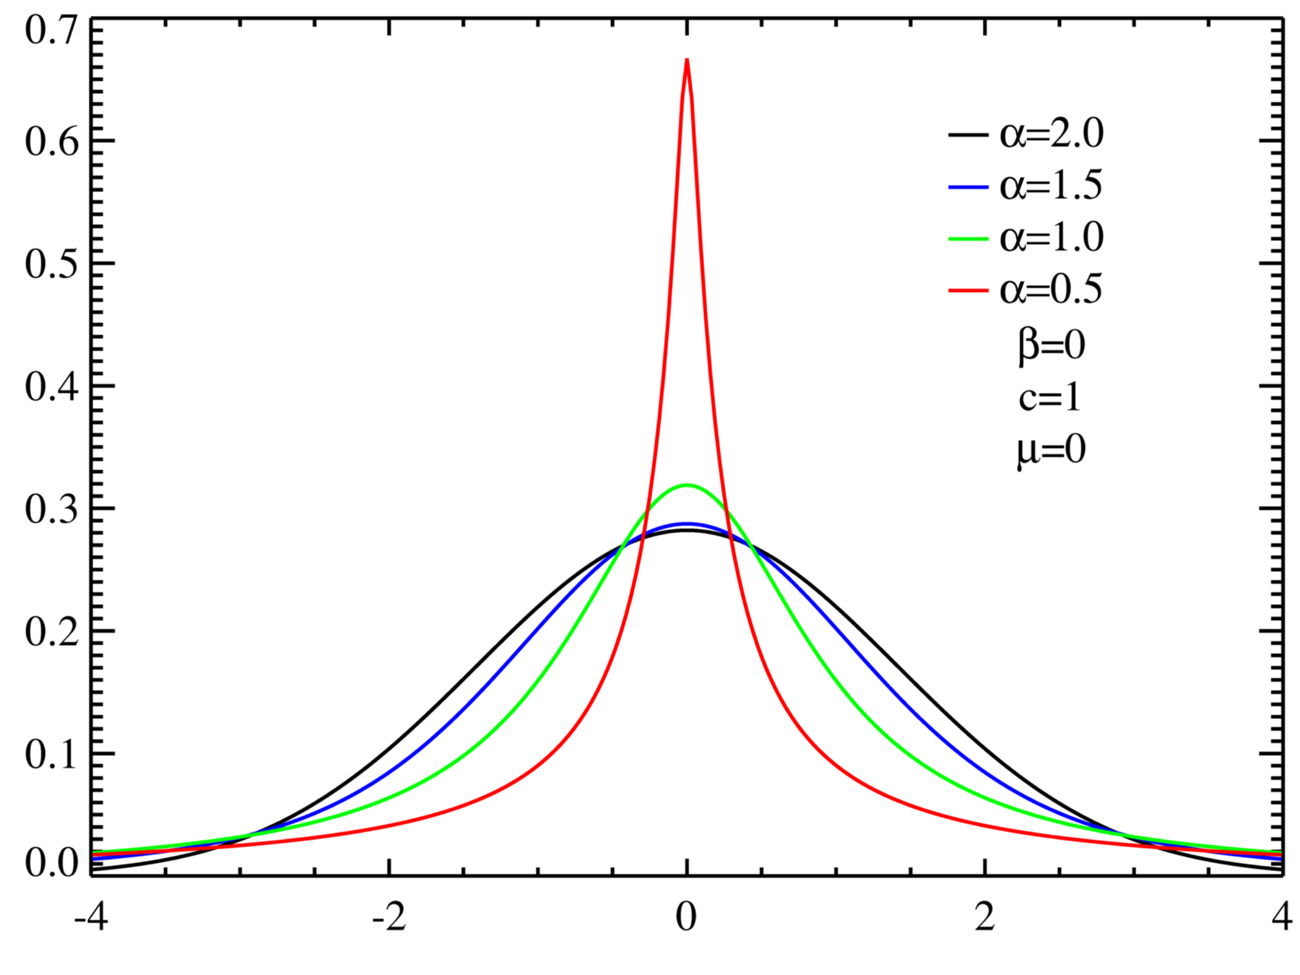
The mainstay of quantitative finance is the log-normal distribution (figure at the top of the posting), where individual instances are assumed to multiply, not add (hence the logarithm; the sum of the logarithms of individual factors is the log of their product). But it's easier to compare normals with their Lévy generalizations. The Lévy distributions have the Gaussian as a limiting case (family of distributions labeled by exponent α, with α=2 as the Gaussian case).

Here's a graphed set of Lévy distributions. The normal curve is the black curve:


The Lévy distributions relevant to finance are those with α close to, but less than, two. Notice that for small deviations x from the mean (zero), the "α-close-to-2" distributions don't look that different from one another. It's the "outliers" that make the difference clear. For deviations x far from the mean, the non-Gaussian curves fall off slowly; in fact, as power laws ~ |x|-(1+α). These distributions are sometimes called scalable, because they have no fixed, intrinsic scale of deviation that sharply limits how big the deviations can be and that forces the distribution to remain close to the mean.†


This log-log plot shows how much more sharply the Gaussian (black curve) falls off with x than do the the Levy generalizations. Large deviations remain less likely than small; but they are far more likely in the non-Gaussian, power-law, case than in the Gaussian.

The mild versus the wild. The financial world straddles two paradigms.††
  • Mediocristan is a world of conserved or almost-conserved total quantities. They tend to get subdivided in roughly equal ways among all possibilities. The flows of goods, labor, and services (as opposed to their prices) tend to have more of a "mild" behavior, at least over limited periods of time. When they change, the usually change slowly. Rapid changes are rare (but not unknown); large changes are more frequent, but usually happen over months and years.

  • Extremistan is a world of non-conserved total quantities. For example, the total flow of economic value associated with the flow of some thing or some activity is its price (say, dollars/donut) times its physical flow (say, donuts/day). Everything associated with prices (including interest rates and wages, which are prices for capital and labor, respectively) is inherently subject to full-blown "wildness." Cumulative change is often a result of a fairly small number of big events, with the large crowd of small events making not much difference to the total.
Coping with the chaos of prices and related information requires learning two apparently contradictory lessons:
  • How to ignore daily fluctuations, not take numbers in isolation, and not worry about undefined hypotheticals. Few days are important in the grand scheme of things.

  • How to keep an open mind to the occasional "grey swan" and the rarer but consequential "black swan" - which, when it happens, can happen in a few days, or even hours.
We'll look at these next.

References

= B. Mandelbrot, The Fractal Geometry of Nature and (with et al.) Fractals and Scaling in Finance. The first is a modern classic and should be read by anyone with the slightest interest in mathematics. The second is an empirical study of price movements-cum-critique of Gaussian quantitative finance.

= N. N. Taleb, The Black Swan: The Impact of the Highly Improbable. Reviewed here.

= M. Lax, Random Processes in Physics and Finance. Much more technical, part of the burgeoning field of econophysics.
---
* If they are assumed to also be in control of everything, we have a conspiracy theory.

** There is a branch of statistical physics, called frustration or quenched disorder theory (spin glasses) that treats systems evolving under multiple, conflicting, and random constraints.

† The Lévy distributions are the class of probability distributions that enjoy the property that a sum of Lévy-distributed variables is also distributed according to a (slightly different) Lévy distribution. This is like the central limit theorem of the Gaussian bell curve, but more general. It doesn't require the distribution moments, or weightings, to be defined. In the general Lévy case, they're infinite anyway, because of the "fat tails" for large deviations from the mean.

†† This distinction, earlier than Taleb's, is due to Mandelbrot.

Labels: , , , , ,

Sunday, March 23, 2008

Fat tails and outliers: A closer look

No, it's not about the Fat Tonys of the world, Taleb's proverbial cabdrivers who know at least as much about events as so-called experts, not because they're so smart, but because the so-called experts know far less than they think. But Fat Tony might appreciate the world of "fat-tailed" probability distributions, since they provide the mathematical way of capturing, in part, the phenomenon of the black swan: why large deviations from the mean ("outliers") are less common than small ones, but still much more common than expected on the basis of the normal or Gaussian bell-curve distribution.

The Gaussian distribution is used so much because of an important mathematical result, the Central Limit Theorem (CLT). It states that, if we consider a large number of instances of a random process, the collective "distribution of distributions" is Gaussian, if certain conditions hold. These conditions are that:
  • The individual instances making up the distribution must be independent of one another.
  • The moments, or weighted averages, of the original probability distribution must be finite.
What happens in the "large numbers" limit, if these conditions hold, is that, of all the moments of the original distribution, only three matter after the dust settles - the total population size, the mean, and the variance (the zeroth, first, and second moments - see below). All the other moments either vanish or are controlled by the first three. These three are exactly the ones needed to define a Gaussian bell curve.

A simple example. Let's consider a population of particular instances of some property or attribute, quantified by a random variable x, allowed to range from -∞ to +∞. Its probability density is f(x); within an infinitesimal range dx, the total number of instances between x and x+dx is f(x) dx. The cumulative number of all instances of x < X is the integral of f(x) from -∞ to X. Define the nth moment (or weighted area under the curve) as M(n) = ∫ xn f(x) dx. The non-negative integer n = 0, 1, 2, ... ∞.

The Gaussian with zero mean and variance of one is f(x) = exp(-x2/2)/√(2π). (The normalization is chosen such that M(0) = 1.) It is strongly peaked at x = 0 (the mean) and falls off rapidly for deviations from the mean.

The "fat tail" case occurs when, whatever f(x) is doing for small x, it decreases for large x as |x|-a, a > 0, apart from overall multiplicative constants. f(x) falls off for large x, but far more slowly than the Gaussian does. Then M(n) ~ ∫ |x|n-a dx. Replace the upper (lower) limit of the integral with +X (-X), X → +∞. Then M(n) ~ Xn-a+1. There are three possibilities:
  • n - a + 1 < 0. The moment M(n) is defined (convergent or finite).
  • n - a + 1 = 0. The moment M(n) is infinite, diverging logarithmically.
  • n - a + 1 > 0. The moment M(n) is infinite, diverging as a positive power.
For a "fat-tailed" distribution behaving this way, while some moments (for lower n) might be defined, the remaining moments n > a - 1 are undefined. Therefore the CLT does not hold, and it is not correct to use Gaussian-based statistical methods for such populations.*

Long before Fat Tony.... Such distributions are called, in the mathematical literature, Lévy flights, after the French mathematician Paul Lévy, who first worked with them in the decade prior to the Second World War. Mandelbrot, the geometer of fractals, was a student of Lévy. Both Lévy and Mandelbrot went into hiding after the French defeat in 1940, avoiding the Nazi and Vichy dragnet of French Jews.

After the war, they were also intellectual refugees from a certain style of mathematics that swept over the French academic world and had a strong influence elsewhere. Collectively named the Bourbaki school, it drove applied and "heuristic" mathematics to the margins of the field and favored a lean, abstract approach of theorem-proof, with no pictures, diagrams, or applications. (It was the same period that the artistic avant-garde moved strongly in the same direction: away from sense perception, toward "pure" abstraction.) The situation relaxed in the 1970s and 1980s, followed by a strong revival of interest in applied mathematics both among mathematicians and scientists and engineers who use mathematics. While rigor and precision are essential to mathematics, it can't survive or even make sense without contact with applied problems and the world of the senses, and the Bourbaki revolution petered out.

Using Lévy's results, Russian mathematicians Gnedenko and Kolmogorov proved a generalization of the Central Limit Theorem that allows for systematic statistical methods to be applied even in such Extremistan cases. But the resulting "distribution of distributions" is not Gaussian. If we want to study the statistics of events in a chaotic system, like the climate or financial markets, say, we must use these generalized methods pioneered by Lévy, not the 19th-century methods of binomials, Poisson, and Gauss. Like 20th-century artistic palettes and musical styles, it's a 20th-century statistics cookbook of expanded possibilities and greater generality. In the next posting, we'll meet a recent climate case where appropriate statistical methods were applied, with striking results, to a situation where wrong methods were long used.
---
* Usually, a > 1 in practice. If 0 < a < 1, then even the zeroth moment M(0), the total number in the population, is infinite. (The mean and variance are undefined as well.) Mathematicians can still cope with cases where some or all the moments diverge, by using something called the generating function of the probability distribution.

Labels: , , , , ,

Tuesday, March 11, 2008

Strangely attractive

What is that infinitely complex, non-repetitive structure that chaos lays down? Where does all that complexity come from?

Any depiction of chaotic motion necessarily has been generated by observing or calculating a finite elapsed time of motion. So no picture of chaos can ever show its full complexity. An infinite amount of nonrepetitive motion accumulates inside a finite box after an infinite time. And it takes that infinite time to fully exhibit the complexity of the motion. If the motion could be fully executed in any finite time, it would start to repeat on longer times. It wouldn't be chaotic.

A recorded chaotic trajectory of infinite time is called a strange attractor. It's an attractor because the motion doesn't leave the box. It always "sticks around," even as it never repeats. Mathematicians call it strange because of that infinite complexity. Strange attractors are also fractals; that is, objects with infinitely nested self-similarity.

The most famous strange attractor is that one from the first modern investigation of chaos, the Lorenz attractor, named for the man who discovered it.

The fractal concept is more general and has applications in many areas of applied mathematics. They were first discovered in the late 19th century, but not popularized until Mandelbrot brought them to the world's attention starting in the 1960s, showing that such structures are ubiquitous in the natural world.* Here are two.

This is the Sierpinski triangle.


This is a Julia set.


(If this picture reminds you of a spiral galaxy or a starfish, that's not an accident.)


Where does all that infinite complexity come from? Such structures, by not representing something repetitive, seem to have encoded in them an infinite amount of information. How can that happen?

It's our old friends, the irrational numbers, again. A rational number, being a ratio of integers, contains a finite amount of information. If you decimal-expand a fraction, that decimal form will eventually start to repeat, indicating that a rational number has "nothing more interesting to say" after a finite number of digits.


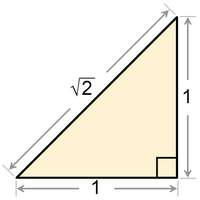
Not so an irrational number. Its decimal expansion never repeats. The square root of 2 is irrational.**

= 1.41421356237309 ....

"Never repeats" - sound familiar? It should. It's the essential characteristic of chaos: bounded nonrepetition. Chaos "processes" the infinite amount of information in the continuum of irrational numbers into infinitely detailed structure, but takes an infinite time to do so.

POSTSCRIPT: Learn more about chaos and the people who discovered it from one of the classics of modern science, James Glieck's Chaos: Making a New Science (1987).
---
* Fractals have even become a basic element of realistic computer graphics today, allowing the creation of much more realistic clouds and landscape, for example, than anything based on those boring old Platonic shapes of spheres, boxes, and so on. All thanks to Benoît.

Chaos was also first discovered in the late 19th century, by the French mathematician Poincaré. Based on his study of irregular planetary orbits, he was able to imagine the infinitely filigreed complexity of the strange attractor. But the terminology and true import of chaos had to await the 1960s and advent of the electronic computer. Then mathematicians and physicists could really investigate the complex subtleties of chaos and let computers do all the calculational drudgery of the necessary arithmetic.

In the 1950s, the Italian-American physicist Fermi, after an encounter with an earlier forerunner of chaos, referred to the study of linear systems that so fills up science and engineering education as the study of "elephant animals." Everything else was "non-elephant animals" - that is, most animals - and he wondered why we didn't spend more effort studying all those non-elephants.

** The square root of two is the first number known to be proven to be irrational. That is, it cannot be represented as the ratio of two integers. For several proofs, see here.

Labels: , , , , , , , ,