
Chaos and markets I
 Chaos as an idea and metaphor applies not only to the natural sciences, but the study of human society as well. It's always important to clearly distinguish between metaphors, and models and analogies. The former are loose and poetic, and treacherous if you try to extract precise conclusions from them. The latter are misleadingly precise and suffer from the illusion that everything about chaos can be reduced to cookbook. Fuzzy is comprehensive but imprecise; precise only seems under control, because the untamable part of chaos gets excluded before you even start. When facing chaos, it's better to be approximately right than precisely wrong. So caveat emptor.
Financial and other economic markets are prime examples of chaotic behavior in human life. They feature individual agents acting rationally, but with limited information and often conflicting goals. The torrent of financial information available gives many people the illusion that, somewhere, someone knows what's going on.* Actually, the people in charge of large institutions and the power to set rules of the game are often some of the more poorly-informed actors, precisely because the scope of their responsibility is so broad and the impact of their decisions so difficult to fathom ahead of time.
There are experiments in behavioral economics that do yield important and controlled information about human economic reasoning and decision-making. But the whole subject, while fascinating and full of insights about the limitations of "economic rationality," is in its infancy. Hopefully, in coming years, the results of behavioral economics will come to displace the "likely-story" Platonified and often false mathematical models that have ruled in economics and finance since the 1960s.**
Economies and cycles. Economic evolution does show some characteristics of irregular waves and more regular cycles. The best known is the six-to-ten-year business cycle, which is an investment-driven cycle in which consumption of what is produced is the final step closing the loop. Recessions occur at the end of these cycles, when investment and consumption across the whole economy tend to get weak all at once. There are shorter-term cycles, of roughly two to four years in length, which are inventory or "reservoir" cycles associated with economic demand rising and falling in various sectors (like housing, in the current bust). They're waves of building up and depletion of inventories. These waves of bubble and bust can be amplified by bad government policy (again, as we're seeing now).
Longer, irregular waves of economic activity are harder to pin down, but well-attested in the historical record. The best-known, if still controversial, is the Kondratieff wave, of approximately 50 to 70 years in length. It's the "two-generation" economic wave.
Cycles! None of these phenomena is simply periodic, but irregular - multiperiodic, shot through with some chaos.
Economics and statistics: Normal, log-normal, and power laws. If we forget about specific events, specific times, and specific histories, we fall back on a statistical description of economic change. Individual events get binned by type, character, and frequency. When we look at economic change as fluctuations of prices and flows of goods, we see the effect of both "normal" and "fat tail" processes everywhere. These form an object lesson in the power of "black swans" and the larger crowd of "grey swans" to shape economic history.
The mainstay of quantitative finance is the log-normal distribution (figure at the top of the posting), where individual instances are assumed to multiply, not add (hence the logarithm; the sum of the logarithms of individual factors is the log of their product). But it's easier to compare normals with their Lévy generalizations. The Lévy distributions have the Gaussian as a limiting case (family of distributions labeled by exponent α, with α=2 as the Gaussian case).
Here's a graphed set of Lévy distributions. The normal curve is the black curve:
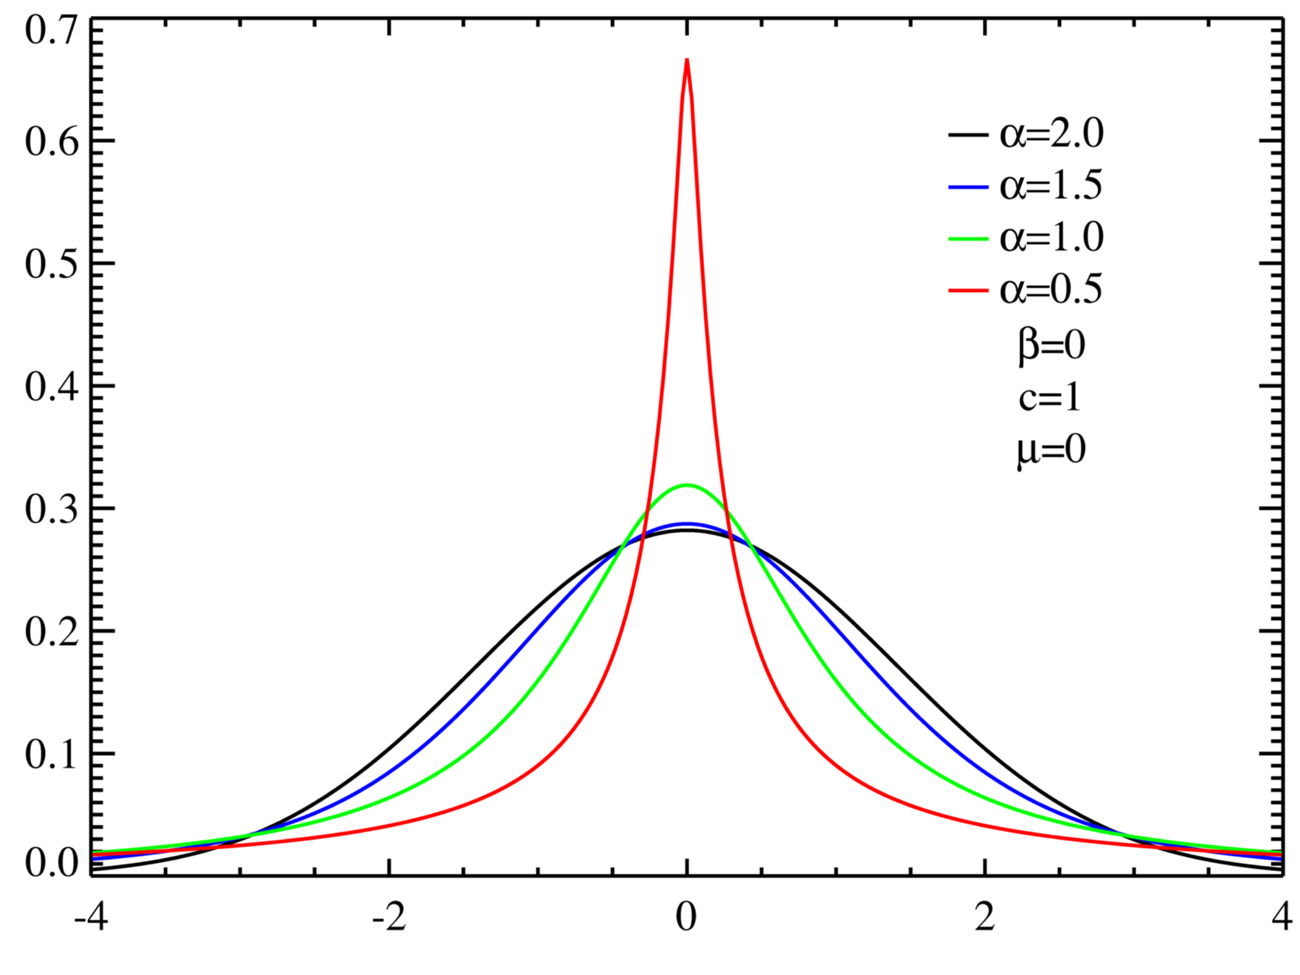
The Lévy distributions relevant to finance are those with α close to, but less than, two. Notice that for small deviations x from the mean (zero), the "α-close-to-2" distributions don't look that different from one another. It's the "outliers" that make the difference clear. For deviations x far from the mean, the non-Gaussian curves fall off slowly; in fact, as power laws ~ |x|-(1+α). These distributions are sometimes called scalable, because they have no fixed, intrinsic scale of deviation that sharply limits how big the deviations can be and that forces the distribution to remain close to the mean.†

This log-log plot shows how much more sharply the Gaussian (black curve) falls off with x than do the the Levy generalizations. Large deviations remain less likely than small; but they are far more likely in the non-Gaussian, power-law, case than in the Gaussian.
The mild versus the wild. The financial world straddles two paradigms.††
- Mediocristan is a world of conserved or almost-conserved total quantities. They tend to get subdivided in roughly equal ways among all possibilities. The flows of goods, labor, and services (as opposed to their prices) tend to have more of a "mild" behavior, at least over limited periods of time. When they change, the usually change slowly. Rapid changes are rare (but not unknown); large changes are more frequent, but usually happen over months and years.
- Extremistan is a world of non-conserved total quantities. For example, the total flow of economic value associated with the flow of some thing or some activity is its price (say, dollars/donut) times its physical flow (say, donuts/day). Everything associated with prices (including interest rates and wages, which are prices for capital and labor, respectively) is inherently subject to full-blown "wildness." Cumulative change is often a result of a fairly small number of big events, with the large crowd of small events making not much difference to the total.
- How to ignore daily fluctuations, not take numbers in isolation, and not worry about undefined hypotheticals. Few days are important in the grand scheme of things.
- How to keep an open mind to the occasional "grey swan" and the rarer but consequential "black swan" - which, when it happens, can happen in a few days, or even hours.
References
= B. Mandelbrot, The Fractal Geometry of Nature and (with et al.) Fractals and Scaling in Finance. The first is a modern classic and should be read by anyone with the slightest interest in mathematics. The second is an empirical study of price movements-cum-critique of Gaussian quantitative finance.
= N. N. Taleb, The Black Swan: The Impact of the Highly Improbable. Reviewed here.
= M. Lax, Random Processes in Physics and Finance. Much more technical, part of the burgeoning field of econophysics.
---
* If they are assumed to also be in control of everything, we have a conspiracy theory.
** There is a branch of statistical physics, called frustration or quenched disorder theory (spin glasses) that treats systems evolving under multiple, conflicting, and random constraints.
† The Lévy distributions are the class of probability distributions that enjoy the property that a sum of Lévy-distributed variables is also distributed according to a (slightly different) Lévy distribution. This is like the central limit theorem of the Gaussian bell curve, but more general. It doesn't require the distribution moments, or weightings, to be defined. In the general Lévy case, they're infinite anyway, because of the "fat tails" for large deviations from the mean.
†† This distinction, earlier than Taleb's, is due to Mandelbrot.
Labels: chaos, cycles, finance, Mandelbrot, statistics, Taleb
posted by Binah @ 9:58 PM
0 comments
![]()

0 Comments:
Post a Comment
<< Home